Announcement

Collapse
No announcement yet.

RoboForex - Forex Broker: overview and news

Collapse
X
 
  • Filter
  • Time
  • Show
Clear All
new posts

  • How to Invest in S&P 500?

    Author: Maks Artemov

    In this article, we will discuss trading S&P 500. In the exchange, this index is trading under the ticker US500; today, it can be found in many popular trading terminals.

    What is S&P500?

    S&P 500 was created by Standard and Poor’s (currently S&P Global) on March 4th, 1957.

    Earlier, another index called Dow Jones Industrial Average Index used to be popular. It included the 30 largest industrial companies. Also, other indices were there; however, they covered only a small group of companies, hence, did not represent the whole picture of market moods.Standard and Poor’s went their own way and decided to create an index that would show the market situation on the whole and not just the state of things in the industrial sector. This is how the S&P 500 appeared.

    The new index was comprised of 500 large companies with the biggest capitalization from various sectors. However, the number of companies and the exact contents of the index remains prone to change.

    What are the companies in the S&P 500?

    The index includes the 500 largest companies traded in the US stock market. To be listed in the index, a company must comply with the following requirements:
    • capitalization no less than 6 billion USD.
    • registered in the USA.
    • stock liquidity (the number of stocks traded) no less than 250,000 per month.
    • no less than 50% of the stocks available for free trade.
    • profitability during the four last months of the accounting period.

    The list of companies is revised every quarter. If a company turns out to be faulty in a way, it is replaced by another suitable company. Usually, the list loses companies that start generating losses in the accounting period or the liquidity of which drops.

    The leaders of the index are currently the giants of the IT and banking sectors, such as:
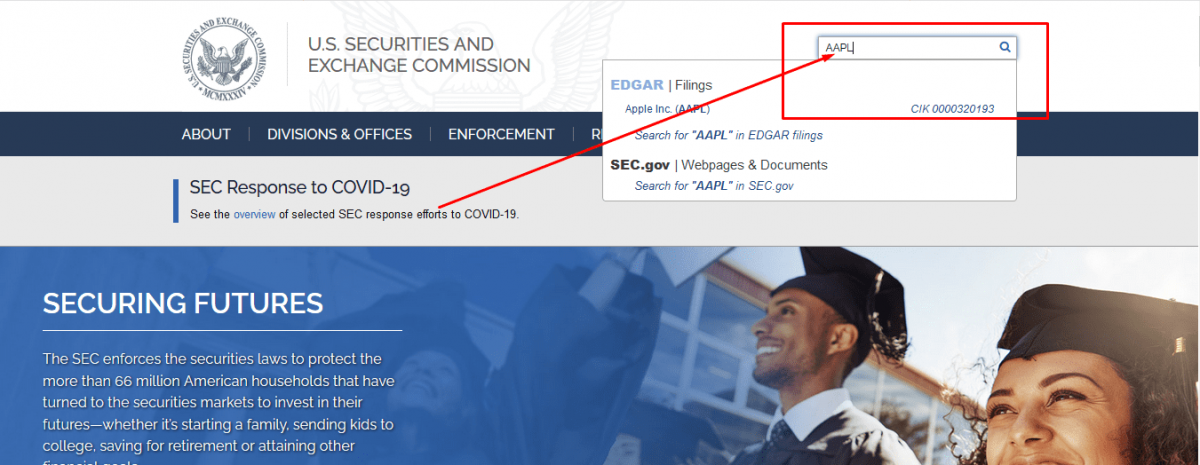
    • Apple Inc (NASDAQ: AAPL).
    • Microsoft Corporation (NASDAQ: MSFT).
    • Amazon.com Inc (NASDAQ: AMZN).
    • Facebook Inc (NASDAQ: FB).
    • JPMorgan Chase & Co (NYSE: JPM).

    IT companies take over 27% of the index, healthcare companies – 14%; the shares of the remaining spheres are not that significant, though they comprise more than 50% of the index, taken together.

    S&P 500 is calculated based on weighted capitalization, which means companies that have larger capitalization have more influence.

    How to invest in the S&P 500?

    S&P 500 is good for not only intraday trading but medium-term investments as well. Thanks to many market players being interested, the index demonstrates high volatility and liquidity during the trading session. Also, you can go on trading after the trading session ends, though liquidity will shrink.

    The only limitation for future investors is the high price of the index, which entails the use of leverage or the increase of the deposit.

    Read more at R Blog - RoboForex

    Sincerely,
    RoboForex team

    Comment


    • Ho to Trade Bryce Gilmore’s Graphic Patterns

      Author: Andrey Goilov Nowadays, there are plenty of various graphic patterns for trading. Some are classical, some are modernized. Every trader tries to supplement graphic patterns with their own secret features to make them more efficient.

      For example, previously, investors used to trade the Head and Shoulders pattern at the breakaway of the “neck” only; however, these days, many traders do not wait for the pattern to be complete but trade while it is still forming. Thus, they can enter the market with a much shorter Stop Loss.

      Bryce Gilmore is one of the traders who added their rules to and found interesting mechanisms in the work of classic trading patterns. Many patterns from his books coincide with the views of other graphic traders.

      On the one hand, there is nothing complicated to his novelties; on the other hand, one has to spend a lot of time to come to such conclusions on their own. However, with all the books and articles, a beginner only needs to read and reread them thoroughly and apply the knowledge to the current market.

      All Bryce Gilmore’s patterns can be conditionally divided into two groups (like all other graphic patterns): those of trend continuation and those of trend reversal. In this article, we will discuss the main price structures only. The author has plenty of patterns in store but you do not need to know all of them to trade successfully: you can choose a couple and learn how to use them properly in compliance with your capital management rules.

      Trend reversal patterns

      The Head and Shoulders pattern

      Bryce Gilmore insists on calling this pattern like this, and we cannot deny that it is very similar to the classical pattern.

      However, here, there is a large difference between the classical and original approaches. In normal tech analysis, few traders speak about selling from exactly the right “shoulder” of the pattern. As for Gilmore, he notes that if the “shoulders” are more or less equal, we can open a selling or buying position depending on where the pattern is aimed.

      https://blog.roboforex.com/wp-content/uploads/2020/11/gilmore-pic-1.png

      Moreover, he neglects the slope of the “neck” completely: even if the line is heading down, we can still open a buying position provided that the “shoulders” are equal.

      https://blog.roboforex.com/wp-content/uploads/2020/11/gilmore-pic-2.png

      I will remind you that in classical tech analysis, the “neck” must be aimed in the direction of the previous trend. If otherwise, the pattern is not a Head and Shoulders but a Wolfe’s Wave. Some time ago, my colleagues and I singled out this feature and were quite surprised to find a similar idea in the book of another author.

      Read more at R Blog - RoboForex

      Sincerely,
      RoboForex team

      Comment


      • How to Analyze Financial Reports of Companies by IFRS?

        Author: Vadim Kovalenko
        In this article, we will discuss a step-by-step algorithm for analyzing the reports of international public companies so that later, you will analyze them yourself. During the report period, a normal person is overwhelmed by recommendations and advice. However, to form a correct and independent opinion, you have to work with the primary source.

        Where to start from?

        Start the analysis from the website of the company: you will find the reports in the section for investors. See an example in the screenshot below:

        https://blog.roboforex.com/wp-content/uploads/2020/11/1-ifrs1011eng-1200x475.png

        Then a section will open, from where you will be able to download all the reports of the company. Here, we see yearly (10-K form) and quarterly (10-Q form) reports. We are more interested in the 10-K. An example below:

        https://blog.roboforex.com/wp-content/uploads/2020/11/2-ifrs1011-1200x450.png

        If you are not keen on looking for all those sections on the company’s website, just go to the website of the SEC regulator - and download the documents from there. In the search form, enter the ticker of the company:

        https://blog.roboforex.com/wp-content/uploads/2020/11/3-ifrs1011-1200x465.png

        Read more at R Blog - RoboForex

        Sincerely,
        RoboForex team

        Comment


        • How to Trade Renko Charts: Main Strategies

          Author: Victor Gryazin

          In this article, we will discuss a strategy using the Renko charts. This is a specific way of representing the price chart that highlights the size of the movement, regardless of time.

          What is a Renko chart?

          Renko candlestick charts are coming from Japan, where they first appeared and were called "renga", which means "a brick". Such candlesticks look like small rectangle boxes/bricks composing the price chart.

          Renko candlesticks are not bound to timeframes, they are focused on price changes solely. When the market is active, there are more Renko candlesticks on the chart; when the quotations are in a flat, and volatility drops, there are less of them.

          A new candlestick appears only when the price exceeds a set threshold. For example, if the set size of a Renko candlestick is 10 standard points, and the price has grown by 20, there will appear 2 white "bricks", 10 points each.

          If the price is falling, the candlesticks on the chart turn black, each of them also reflects a decrease of 10 points. Thus, a Renko chart shows the general direction of the price movement, smoothing out minor fluctuations.

          https://blog.roboforex.com/wp-content/uploads/2020/11/renko-995x630.png

          The advantages and drawbacks of Renko charts

          Renko chart was created for making the main market trend easier to perceive. As well as other methods of price representation, Renko candlesticks have their advantages and drawbacks.

          The advantages would be:
          • A clear averaged representation of the trend.
          • Filtering of meaningless noises on the chart.
          • Smoother work of indicators and advisors.
          • The chart shows the places of probable trend reversals.
          • The chart represents key support and resistance levels.
          Installing and setting up Renko chart in MT4

          To install the Renko charts to MT 4 trading terminal, first of all, download the files of a special expert advisor RenkoExpertAdvisor via a link at the end of this article. Copy the files to the folder Experts.

          In the Main Menu, open File/Open Data Catalog/MQL 4/Experts. Copy the files of the EA into the folder, then restart the terminal.

          As a result, RenkoExpertAdvisor will appear in the Navigate window. To add it to the chart of the chosen instrument, left-click and drag it to the necessary window. Then choose Service on the instrument board, click Settings, then proceed to Expert Advisors. Tick Automatic Trade and Import DLL.

          After choosing the settings, in the upper right corner of the chart, you will see a smiling face and the name RenkoExpertAdvisor. Moreover, in the upper left corner, you will see a text, telling you to open a new Renko chart in the autonomous regime. To do it, choose File/Open Autonomously. You will see a window with a list of autonomous charts. Choose a chart with the parameters specified in the upper left corner of the window with the expert advisor. Open it with a double left click of the mouse. A window will appear with a Renko chart that will be constantly renewed. Now you can add indicators to Renko charts and start trading.

          https://blog.roboforex.com/wp-content/uploads/2020/11/renko-settings-998x630.png

          Read more at R Blog - RoboForex

          Sincerely,
          RoboForex team

          Comment


          • RoboForex teamRoboForex: changes in trading schedule (Thanksgiving Day in the USA)
            https://roboforex.com/uploads/img/news/main/roboforex-header.jpg
            https://www.forexsignals.com/forum/core/image/gif;base64,R0lGODlhAQABAPABAP///wAAACH5BAEKAAAALAAAAAABAAEAAAICRAEAOw==
            Dear Clients and Partners,

            We’re informing you that due to the celebration of Thanksgiving Day in the United States of America, several instruments will be traded according to the changed schedule*.

            MetaTrader 4 / MetaTrader 5 platforms

            Trading schedule on CFDs on oil (WTI, Brent), Metals (XAUUSD, XAGUSD), CFD on US indices (US500Cash, US30Cash, USTECHCash) and Japanese index JP225Cash
            • November 26th, 2020 – trading stops at 7:40 PM server time.
            • November 27th, 2020 – trading stops at 8:00 PM server time.
            Trading schedule on CFDs on US stocks
            • November 26th, 2020 – no trading.
            • November 27th, 2020 – trading stops at 8:00 PM server time.
            R Trader platform

            Trading schedule on US stocks, CFDs on US stocks, US indices, and ETFs
            • November 26th, 2020 – no trading.
            • November 27th, 2020 – trading stops at 8:00 PM server time.
            Trading schedule on Metals (XAUUSD, XAGUSD) and CFDs on Crude Oil (BRENT.oil, WTI.oil)
            • November 26th, 2020 – trading stops at 7:40 PM server time.
            • November 27th, 2020 – trading stops at 8:00 PM server time.
            cTrader platform

            Trading schedule on Metals (XAUUSD, XAGUSD)
            • November 26th, 2020 – trading stops at 7:40 PM server time.
            • November 27th, 2020 – trading stops at 8:00 PM server time.
            Please, take into account these changes in schedule when planning your trading activity.

            * – This schedule is for informational purposes only and may be changed.

            Sincerely,
            RoboForex team

            Comment


            • The MFI: Peculiarities and Trading Strategies

              Author: Maks Artemov

              Today, we will get acquainted with the MFI (Market Facilitation Index). It was developed by an experienced trader Bill Williams and described in his book “The Trading Chaos”.

              The author aimed at research and quality analysis of the ratio between trade volumes and the price of the asset. He assumed that the trade volume or turnover initiated growth. The larger the volume of the asset, the brighter the price growth.

              Placement and appearance

              In MT4, you can find the MFI in Indicators – Bill Williams. The indicator is displayed in a separate window under the price chart and looks like a histogram made of bars of four different colors. The color and width of the bars are customizable. By default, the colors are as follows:
              • MFI upwards, volume up – Lime
              • MFI downwards, volume down – SaddleBrown
              • MFI upwards, volume down – Blue
              • MFI downwards, volume up
              Usually, it is up to the trader whether to place highs and lows – normally, they are not used in trading by the MFI. The indicator has no other settings.

              https://blog.roboforex.com/wp-content/uploads/2020/10/mfi-1-1200x605.png

              What does the MFI show?

              The indicator provides the following information:
              • The green bar means that the number of market operations increases and the trend is getting stronger. The current impulse may continue because new players come to the market and make a lot of operations. This signal is not meant for opening positions because the impulse emerged much earlier, and the price has already covered a long distance. But if the trader already has an open position, the growth of the green bar will mean they were right.
              • The brown bar means that volatility and liquidity are falling because market players are losing interest. Usually, such a bar precedes a flat, and the probability of a reversal is almost null. After the flat, the price may proceed in either direction with equal probability.
              • The blue bar indicates that the impulse is currently developing not because some new players have entered the market but because either buyers or sellers are leaving it. They have lost interest in the asset, and the situation is dubious.
              • The Pink bar shows that both bulls and bears are active. This bar promises a reversal and is most preferable for traders.
              Though the MFI gives certain information to the trader, the author advises against trading by this indicator only. It should be used alongside other indicators or some trading strategy.

              https://blog.roboforex.com/wp-content/uploads/2020/10/mfi-2-1200x545.png

              Read more at R Blog - RoboForex

              Sincerely,
              RoboForex team

              Comment


              • RoboForex Team launches RFund - a new Alternative Investment Fund

                We’re pleased to inform you about the launch of a European alternative investment fund called RFund, which is regulated by the CySEC, license No. N. LPAIF118/2014. We’re actively expanding and pressing forward, that’s why the creation of our own investment fund was the next logical step of brand globalization.

                The year 2020 will make history as a period that brought us not only the pandemic but also new all-time highs in major global indices. During this time of extraordinary volatility, we’re ready to offer you cutting-edge solutions in portfolio management, which are based on our long-term experience combined with the conservative approach to the choice of assets for investments.

                What makes us different?
                • New approaches to management – using up-to-date methods in risk budgeting and portfolio management coming to replace modeling principles that are based on historic data and vulnerable to high degree stochasticity of relationships between instruments.
                • Approach to diversification – investment policy implies the allocation of most of the assets in the units of other funds – instruments, which are diversified between assets within their instrument class.
                • Conservative approach to the choice of assets – the fund neither uses leverage nor considers investments in complex derivatives on credit swaps, in cryptocurrencies, and other similar instruments.
                • Transparent costs structure – investors pay only a fixed management fee of 2% and a performance fee of 20% on the return that exceeds 7% annual in the current financial year.
                Who can invest with RFund?
                • The Funds is available only to investors from Europe, who are qualified as "Professional investors" or "Well-informed investors".
                • The minimum invested sums for professional and well-informed investors are 100,000 USD and 125,000 EUR (in USD equivalent) respectively.


                Sincerely,
                RoboForex team

                Comment


                • Ten Point Trading Strategy: Morning and Night

                  Author: Maks Artemov

                  The Ten Point trading strategy is well-known by a wide circle of market participants and is based on simple entry rules; the percentage of profitable trades is quite high. An everyday profit, even if it is small, is good not only for the deposit but for the trader’s attitude to the market situation. This, in turn, inspires the trader for further work.

                  Peculiarities of Ten Points

                  The main part of beginners in Forex meet their death as traders due to trivial greed and endless losing trades. Meanwhile, beginners dream of making a huge profit right from the start, ignoring safety issues of careless and thoughtless strategy. Many do not guess that it is much easier to make small profits daily instead of a huge profit once in a long time.

                  So, for a beginner, it is much easier to find one entry point on a technical level a day and take their almost guaranteed 10-20 points of profit per session, spending the remaining time on analyzing the situation and perfecting their trading strategy that will later bring the profit.

                  Option one: trading at night

                  At the opening of a trading session (00:00 GMT), the trader draws support and resistance levels based on the data from the previous session. We look for the highs and lows of the preceding period. There is a theory that the price may break away the highs and lows of the previous session because major market players put their Stop Losses and pending orders there.

                  When such orders are triggered, the price may make a sharp movement, which is what we are looking for. Some might say that we are making wild guesses about the direction in which the price will go, but this is the point.

                  Entering the position

                  Marking the high and low on the chart, place pending orders on their breakaways. Use Buy Stop for buys and Sell Stop for sales. To decrease the probability of false triggering, place the orders two points away from the extreme (the Buy Stop – two points above the high, the Sell Stop – two points below the low).

                  Wait for the trading situation to develop. The Stop Loss is 20 points away from the entry point. As the name of the strategy suggests, the TP is 10 points away from the entry price. Let us now discuss the situation when these conditions change.

                  Exiting the position

                  The first condition is triggering of one of the orders; in this case, delete the second one manually, regardless of the results.

                  The second way of exiting is deleting both orders at the end of the trading session, if they have not been triggered, and placing new ones based on the new data.

                  https://blog.roboforex.com/wp-content/uploads/2020/09/ris-1-buy-10-pips-1200x540.png


                  https://blog.roboforex.com/wp-content/uploads/2020/10/mfi-2-1200x545.png
                  Ten Point trading strategy - Buy


                  https://blog.roboforex.com/wp-content/uploads/2020/09/ris-2-sell-10-pips-1200x540.png
                  Ten Point trading strategy - Sell
                  Read more at R Blog - RoboForex

                  Sincerely,
                  RoboForex team

                  Comment


                  • RoboForex received prestigious awards of the financial sector

                    RoboForex has once again been recognized by the professional community of traders and won several prestigious awards, such as "Best Investment Products (Global)" from Global Brands Magazine Awards, "Best Partnership Program (LATAM)" from Global Banking & Finance Awards, and "Most Trusted Broker" according to Business Magazine Awards.

                    We thank our clients and partners for choosing our company for cooperation and continuing investing and expanding their businesses together with us. RoboForex has always been paying particular attention to maintaining a high-quality level of provided services, as well as developing new up-to-date products. Our latest achievements are clear proof that the company chose the right path and an excellent motivation for further development.

                    Start trading


                    Sincerely,
                    RoboForex team

                    Comment


                    • How to Scalp in Forex: A Guide to Scalping

                      Author: Victor Gryazin


                      In this overview, we will discuss what is scalping and whether it suits everyone. Scalping is a popular method of short-term trading in Forex with the use of leverage.

                      What is scalping?

                      Under scalping, traders mean short-term intraday trading strategies. The term originates in the Latin “scalpere” - “to cut”. Scalping presumes a lot of intraday trades – short and with modest goals. The technique consists of quickly “cutting” small profits off the price movement.

                      The option of marginal trading (i.e. with the use of leverage) has made scalping quite a popular strategy. A small fluctuation by a couple of points can bring the trader a serious profit thanks to large leverage. Scalping is perfect for traders with a small deposit that does not allow for long-term positional trading. For scalping, we use small timeframes: M1, M5, M15.

                      Trading strategies for scalping

                      Nowadays, you can find plenty of scalping strategies on the net. Still, approach every strategy individually: one trader prefers an empty price chart, another one enjoys indicators, the third one sticks to automatic trading.

                      Choose your strategy based on your preferences and test it well on a demo account before trading for real. Now let us discuss three strategies meant for scalping.

                      Victory trading strategy

                      This is a strategy that uses indicators; it consists of scalping on M1 and M5. The indicators used are the TMA, TMA Size, CTF, Currency Power Meter, SSRC, HP DIFF. In our blog, we have a detailed article about this strategy.

                      https://blog.roboforex.com/wp-content/uploads/2020/11/scalping-pobeda.png

                      A scalping strategy with two Moving Averages (EMA)

                      This is a mixed strategy that supplements tech signals on smaller timeframes (M1, M5, M15) with the crossing of two EMAs. The strategy uses tech analysis patterns, support, and resistance levels, the crossing of two EMAs with different periods. This strategy is also described in detail in the article "Scalping Strategy with Two Moving Averages (EMA): Description and Rules".

                      https://blog.roboforex.com/wp-content/uploads/2020/11/scalping-ema-996x630.png

                      BF Scalper Expert Advisor

                      It is an automatized scalping strategy. The expert advisor uses several technical indicators, the MAs and Bollinger Bands; the timeframe used is M15. The expert advisor demonstrated satisfactory results on tests. Again, take a look at the description in our blog.

                      Read more at R Blog - RoboForex

                      Sincerely,
                      RoboForex team

                      Comment


                      • How to Invest in Gold?

                        Author: Andrey Goilov


                        Gold is a safe-haven asset in times of world financial crises. The pandemics of the coronavirus and political turbulence in 2020 pushed the gold prices up higher than the level of 2000, though at the beginning of the year it cost no more than 1,500 USD per troy ounce.

                        Advantages and drawbacks of investing in gold

                        As you see, there are plenty of options for investing in gold.

                        The easiest way is to invest in exchange instruments, such as futures and CFDs. Trading such instruments, you do not need to buy physical gold, transport, and store it.

                        Compared to mutual funds, such investments are quicker to make a profit; trading CFDs, you can always close the trade yourself and exit the market, waiting for better times. However, to use exchange instruments, you need some minimal knowledge of it.

                        https://blog.roboforex.com/wp-content/uploads/2020/11/pic-1-1.png

                        Currently, the quotations of gold are going down again – buyers failed to hold the highs. However, traders are sure that this is just the beginning of a new wave of growth, and the price will start going up very soon. Regardless of such prominent growth this year and the confidence of traders, gold cannot boast high profitability. For example, Bitcoin grew from 8,000 to 19,500 USD in 2020, leaving gold far behind.

                        https://blog.roboforex.com/wp-content/uploads/2020/11/pic-2.png

                        Why do traders keep investing in it?

                        The main reason is low volatility, compared to digital currencies and stock indices. In this article, we will discuss the ways of investing in gold, the difference between them, and the profitability of investments in this precious metal.

                        Summary

                        Gold is not the most profitable asset. However, you can be sure that it is among the safest ones nowadays. Moreover, even after a decline, it resumes growth, even in times of global crises.

                        Remember that each investor should have their strategy because each person has different demands and financial capabilities.

                        Read more at R Blog - RoboForex

                        Sincerely,
                        RoboForex team

                        Comment


                        • How to Invest in Silver: Available Instruments for Investors

                          Author: Victor Gryazin

                          Silver has been known since ancient times: some of the first silver deposits in Corsica and Cyprus were developed by Phoenicians. Refined silver was a rare treasure at those times, sold for exorbitant prices. Silver was used for making coins, jewelry, tableware, and dishes – such things are found as buried treasures from time to time. Amazing disinfectant properties of silver were noted by Scheele and Paracelsus.

                          In this overview, we will discuss why silver seems attractive to investors and which instruments to choose for investments in it.

                          Why is silver attractive?

                          As long as the global economy is stuck in a crisis provoked by the pandemics, the demand for precious metals is growing. As a rule, precious metals, such as gold and silver, enjoy special attention when the perspectives of currency rates, especially the USD, are vague. Gold, the most popular precious metal, renewed its all-time high this summer.

                          Silver, which is the second most popular precious metal, is also in high demand and growing. As well as gold, it is used for making jewelry, coins, and ingots. The silver market is smaller than the gold market, which makes the quotations more volatile.

                          The supply of silver is formed by three main sources:
                          • Primary production is the production of silver from mined ore. The largest world’s supplier of silver is Mexico, then go Peru, China, and Australia.
                          • Secondary production means remelting pieces of art, jewelry, dishes, and recycling photographic film and electric contacts.
                          • The third source is physical silver deposits. A lot of metal is stored in large exchanges that specialize in trading metals (COMEX, LME) and various state storages.
                          Silver is actively used in industry: the metal is used in car parts, electronic gadgets, solar batteries, and photography. New technologies, such as silver oxide batteries, silver conductive ink, and various silver-based nanotechnologies in medicine, are growing more popular. As a result, the demand for silver is growing gradually, making the metal attractive for investments.

                          https://blog.roboforex.com/wp-content/uploads/2020/12/silver-futures-992x630.png

                          Next, let us discuss popular ways t invest in silver, their advantages and disadvantages so that you could make up your mind.

                          Read more at R Blog - RoboForex

                          Sincerely,
                          RoboForex team
                          Last edited by Vlad RF; 12-08-2020, 12:46 PM.

                          Comment


                          • How to Invest 1,000 USD? Three Versions for Beginners

                            Author: Andrey Goilov

                            A bank deposit will not bring a lot of profit from 1,000 USD; the profit is unlikely to cover up for inflation even. The first thing that comes up in your mind is marginal trading. It allows opening trades for sums much larger than you have on your deposit. Leverage is most often used in the currency market, however, it requires the knowledge of tech analysis and constant monitoring of what is going on. Also, leverage entails additional risks for the investor.

                            Our blog is about trading, so let us try to make up our mind about investing in risky assets and whether you can make money there, or whether it is better to invest your 1,000 USD conservatively.

                            Investments in cryptocurrencies

                            Among super-profitable ones, crypto investments have become trendy. The price for such assets has been sky-rocketing for the last three years. However, after incredible growth, cryptocurrencies switched to downtrends and flats. But the uptrend managed to restore, and since this year, the price for the BTC has grown from 7,500 USD to 19,850 USD. For example, if you bought the Bitcoin for 1,000 USD at the beginning of 2020, you could receive 2,500 USD today, which makes 1,500 USD of profit.

                            https://blog.roboforex.com/wp-content/uploads/2020/12/pic-1-btcusd.png

                            Today, people are investing in cryptocurrencies again. A company that heated the market tangibly is PayPal that made storing and buying crypto possible for citizens of the USA. In the company, they say that the demand for such services turned 3-4 times higher than expected. Investment funds are also considering cryptocurrencies as potentially profitable and add them to their strategies.

                            Investments in gold

                            We have discussed investing in this precious metal in the article “How to Invest in Gold?”. The easiest way was, again, investing in CFDs. Such contracts allow for buying and selling gold without purchasing it physically, just making money on the difference in the prices.

                            At the beginning of 2020, gold cost 1,550 USD per troy ounce. In August, the quotations reached a high of 2,072 USD; currently, they are trading at 1,846 USD. By buying the instrument for 1,000 USD at the beginning of the year, you could make a good profit in the middle of the year already. As for the long run, the pandemics might cause investors to buy gold, which will provoke another increase in the price of the precious metal.

                            https://blog.roboforex.com/wp-content/uploads/2020/12/pic-3-xauusd.png

                            The growth of gold is unlikely to be as impressive as that of cryptocurrencies as it is a more conservative investment instrument. Anyway, many traders these days compare gold and the BTC noting that the latter is replacing the precious metal because it is to move and pay with, and it is supported by traders’ interest.

                            As for the charts, the crypto prices are at their highs while the gold price dropped from 2,070 to 1,846 USD. Cryptocurrencies are more volatile while conservative investors prefer gold.

                            Read more at R Blog - RoboForex

                            Sincerely,
                            RoboForex team

                            Comment


                            • RoboForex: changes in trading schedule (Christmas and New Year holidays)

                              We’re informing you that during Christmas and New Year holidays, instruments will be traded according to an altered schedule*.

                              MetaTrader 4 / MetaTrader 5 platforms

                              Trading schedule for DE30Cash
                              • From December 24th, 2020 to December 25th, 2020 – no trading.
                              • From December 31st, 2020 to January 1st, 2021 – no trading.
                              • January 4th, 2021 – trading starts as usual.

                              Trading schedule for other instruments
                              • December 24th, 2020 – trading stops at 7:00 PM server time.
                              • December 25th, 2020 – no trading.
                              • December 31st, 2020 – trading stops at 8:00 PM server time.
                              • January 1st, 2021 – no trading.
                              • January 4th, 2021 – trading starts as usual.

                              R Trader platform

                              Trading schedule for GER30
                              • From December 24th, 2020 to December 25th, 2020 – no trading.
                              • From December 31st, 2020 to January 1st, 2021 – no trading.
                              • January 4th, 2021 – trading starts as usual.

                              Trading schedule for UK100, SPA35, FRA40
                              • December 24th, 2020 – trading stops at 12:00 PM server time.
                              • December 25th, 2020 – no trading.
                              • December 31st, 2020 – trading stops at 12:00 PM server time
                              • January 1st, 2021 – no trading.
                              • January 4th, 2021 – trading starts as usual.

                              Trading schedule for US Stocks, ETFs, CFDs for US Stocks and ETFs
                              • December 24th, 2020 – trading stops at 7:00 PM server time.
                              • December 25th, 2020 – no trading.
                              • December 31st, 2020 – trading stops at 8:00 PM server time.
                              • January 1st, 2021 – no trading.
                              • January 4th, 2021 – trading starts as usual.

                              Trading schedule for CFDs for EU Stocks
                              • From December 24th, 2020 to December 25th, 2020 – no trading.
                              • From December 31st, 2020 to January 1st, 2021 – no trading.
                              • January 4th, 2021 – trading starts as usual.

                              Trading schedule for other instruments
                              • December 24th, 2020 – trading stops at 7:00 PM server time.
                              • December 25th, 2020 – no trading.
                              • December 31st, 2020 – trading stops at 8:00 PM server time.
                              • January 1st, 2021 – no trading.
                              • January 4th, 2021 – trading starts as usual.

                              cTrader platform

                              Trading schedule for all instruments
                              • December 24th, 2020 – trading stops at 7:00 PM server time.
                              • December 25th, 2020 – no trading.
                              • December 31st, 2020 – trading stops at 8:00 PM server time.
                              • January 1st, 2021 – no trading.
                              • January 4th, 2021 – trading starts as usual.
                              Please, take into account these changes in the schedule when planning your trading activities.

                              * This schedule is for informational purposes only and may be changed by the provider.

                              Sincerely,
                              RoboForex team

                              Comment


                              • How Does Gold Influence on Forex?

                                Author: Victor Gryazin

                                Gold is one of the first metals that people learned to mine, process, and use. First gold artifacts belong to the pre-dynastic period in Ancient Egypt, i.e. about 5000 B.C. Thanks to being beautiful, rare, and durable, gold has always been used as a universal exchange means, an analog of money.

                                In this article, we will discuss how the fluctuations of gold quotations influence the prices on Forex.

                                Gold standard

                                The gold standard is a monetary system that emerged as a result of the wide use of gold as a universal currency. The gold standard guarantees that all the issued money can be exchanged for the corresponding amount of gold on demand. In transactions between countries that use the gold standard a fixed exchange rate of the currencies is used, based on the standard.

                                The gold standard that was in force after WW2 was accepted at a conference in Bretton Woods. According to the international agreement, the USA was committed to providing for the gold standard of 35 USD per troy ounce of gold. Only countries represented by their Central banks got the right to exchange dollars for gold. So, at that time the USD was really supported by gold and acquired the status of the global reserve currency.

                                The epoch of the gold standard ended in 1971 when the USA abandoned the free exchange of the USD for gold. The main reason for the collapse of the Bretton Woods system is the excessive quantity of dollars issued by the USA that were not supported by gold anymore. Since then, the amount of dollars in the world economy keeps growing, currency rates are set by the market, while gold is growing more expensive every year, renewing all-time highs.

                                This year, gold set another record, rising above 2,000 USD per troy ounce. And the growth of gold is likely to continue because the USA keeps printing dollars and pouring them into the global economy.

                                https://blog.roboforex.com/wp-content/uploads/2020/12/gold-990x630.png

                                Which currencies are influenced by gold?

                                The price of gold can influence the rates of almost all currencies. Changes in the demand for and supply of gold affect the USD firsthand because the price of gold is usually given in the USD. Also, the dynamics of gold prices significantly influence those countries that produce the metal at a scale, important for their economies.

                                Read more at R Blog - RoboForex

                                Sincerely,
                                RoboForex team

                                Comment

                                Working...
                                X