 Tweet
Tweet
What is Depth of Market and How Does It Work?
Author: Victor Gryazin
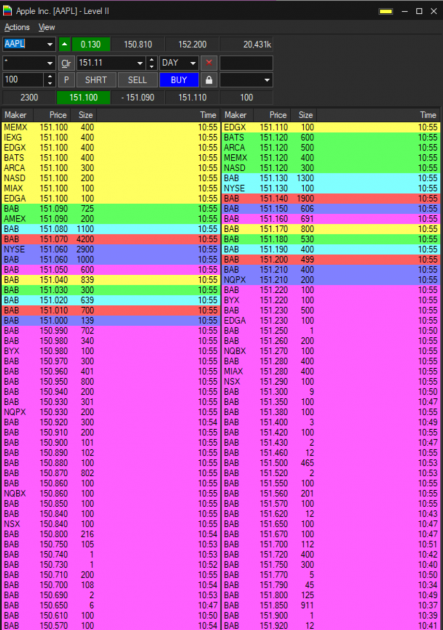
What is DOM?
DOM (Depth of Market, a.k.a. Level 2, Order Book) is a list of current orders to sell and buy a certain trading instrument, presented as a handy table. It demonstrates prices that market players offer at the moment. DOM shows the actual balance of sellers and buyers and thus serves a handy instrument for traders and investors.
Stock market, in essence, is an auction in which sellers and buyers participate. For example, you want to buy 10 stocks at a price you set yourself. Your order gets into DOM, and if your price is close to the current market price, a seller will appear quite soon. However, if there are people in the market who want to buy the stocks at a higher price, you will need to wait until their orders are executed.
What does DOM look like?
Classic DOM is divided into two columns: in the left one prices and volumes of buyers (the number of lots) are presented; in the right one there are prices and volumes of sellers. The difference between the nearest orders to buy and sell is the current spread.
https://blog.roboforex.com/wp-content/uploads/2021/11/Dom-1-443x630.png
The look of DOM depends on the trading terminal you use but general parameters are the same. Normally, orders to sell are at the top and orders to buy are at the bottom. DOM cannot accommodate for all orders placed by buyers and sellers real-time online. Hence, it shows online those orders that are the closest to the current market price.
They are what form the so-called DOM. For example, if DOM is 20*20, the table consists of 20 nearest buy prices and 20 nearest sell prices. This is quite a wide-spread look of DOM that brokers use. However, you can customize it in the trading terminal settings.
Read more at R Blog - RoboForex
Sincerely,
RoboForex team
Author: Victor Gryazin
What is DOM?
DOM (Depth of Market, a.k.a. Level 2, Order Book) is a list of current orders to sell and buy a certain trading instrument, presented as a handy table. It demonstrates prices that market players offer at the moment. DOM shows the actual balance of sellers and buyers and thus serves a handy instrument for traders and investors.
Stock market, in essence, is an auction in which sellers and buyers participate. For example, you want to buy 10 stocks at a price you set yourself. Your order gets into DOM, and if your price is close to the current market price, a seller will appear quite soon. However, if there are people in the market who want to buy the stocks at a higher price, you will need to wait until their orders are executed.
What does DOM look like?
Classic DOM is divided into two columns: in the left one prices and volumes of buyers (the number of lots) are presented; in the right one there are prices and volumes of sellers. The difference between the nearest orders to buy and sell is the current spread.
https://blog.roboforex.com/wp-content/uploads/2021/11/Dom-1-443x630.png
The look of DOM depends on the trading terminal you use but general parameters are the same. Normally, orders to sell are at the top and orders to buy are at the bottom. DOM cannot accommodate for all orders placed by buyers and sellers real-time online. Hence, it shows online those orders that are the closest to the current market price.
They are what form the so-called DOM. For example, if DOM is 20*20, the table consists of 20 nearest buy prices and 20 nearest sell prices. This is quite a wide-spread look of DOM that brokers use. However, you can customize it in the trading terminal settings.
Read more at R Blog - RoboForex
Sincerely,
RoboForex team
Comment