 Tweet
Tweet
Ichimoku Cloud Analysis 05.10.2020 (EURUSD, XAUUSD, GBPUSD)
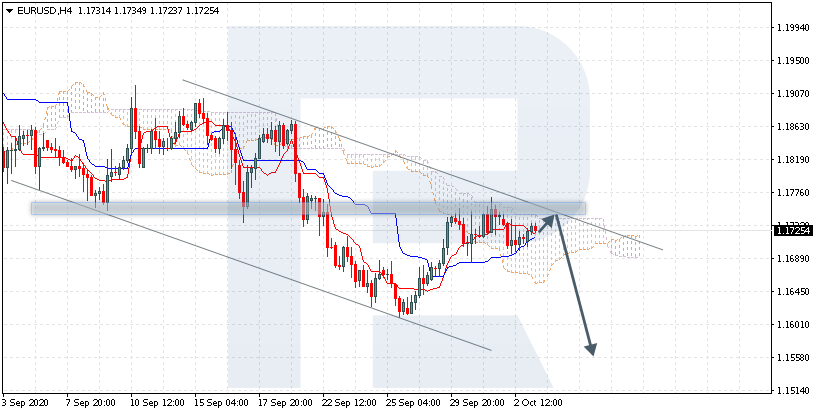
EURUSD, “Euro vs US Dollar”
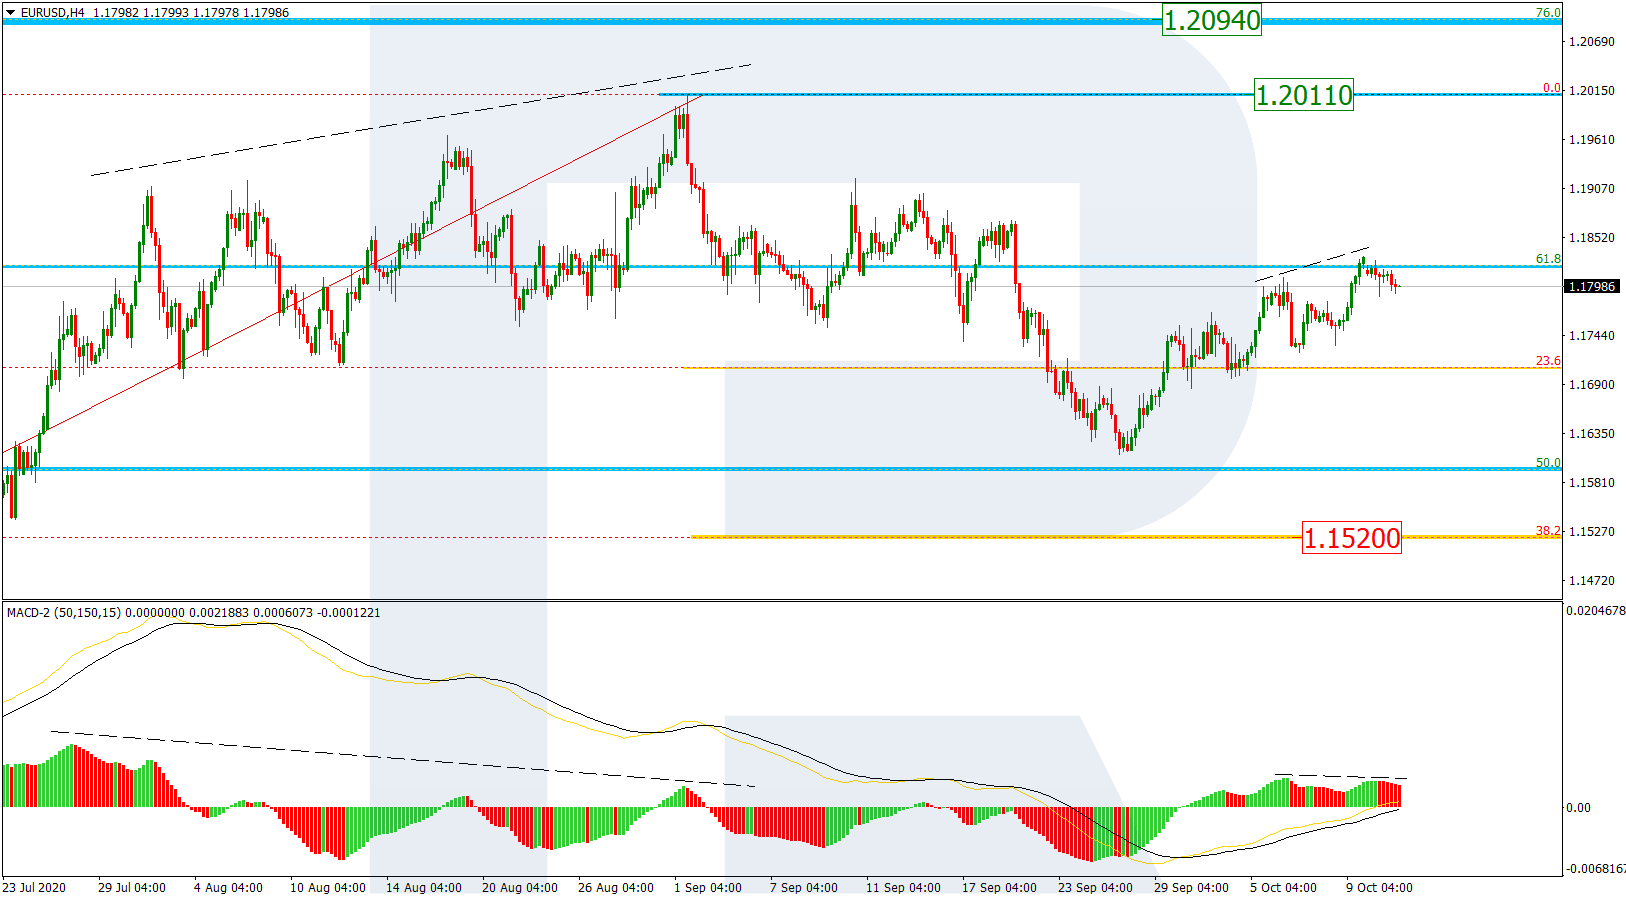
EURUSD is trading at 1.1725; the instrument is moving inside Ichimoku Cloud, thus indicating a sideways tendency. The markets could indicate that the price may test the cloud’s upside border at 1.1735 and then resume moving downwards to reach 1.1555. Another signal in favor of further downtrend will be a rebound from the descending channel’s upside border. However, the bearish scenario may be canceled if the price breaks the cloud’s upside border and fixes above 1.1795. In this case, the pair may continue growing towards 1.1885. To confirm further decline, the asset must break the cloud’s downside border and fix below 1.1635.
Read more - Ichimoku Cloud Analysis EURUSD, XAUUSD, GBPUSD
Comment