Other Top Trading Posts


dAILY Gap USDMXN

Daily 8EMA Gap on USDMXN

USDMXN Long
USDMXN Short

USDMXN Long
USDMXN Long

Now may be a time to invest in Mexico, especially with not taking on further debt...


USDMXN 1H 50/200EMA GAP CLOSE

USDMXN Long

Sell off on the USD
Brake of major support

USDMXN strongly bearish

BCR of Supply and Demand Zone


USDMXN Short


One from the watchlist (Sniper)


Top trade ideas
Get Trade Feedback
dAILY Gap USDMXN
Daily gap on USDMXN Price already BCR on the 200, 15m chart, 1H BC. We have a small gap on 1h chart and you can enter around that level, 21.6914 ENTRY: 21.69914 SL: 21.7460 TP: 21.4400 Trade safe, risk accordingly, do not follow blindly

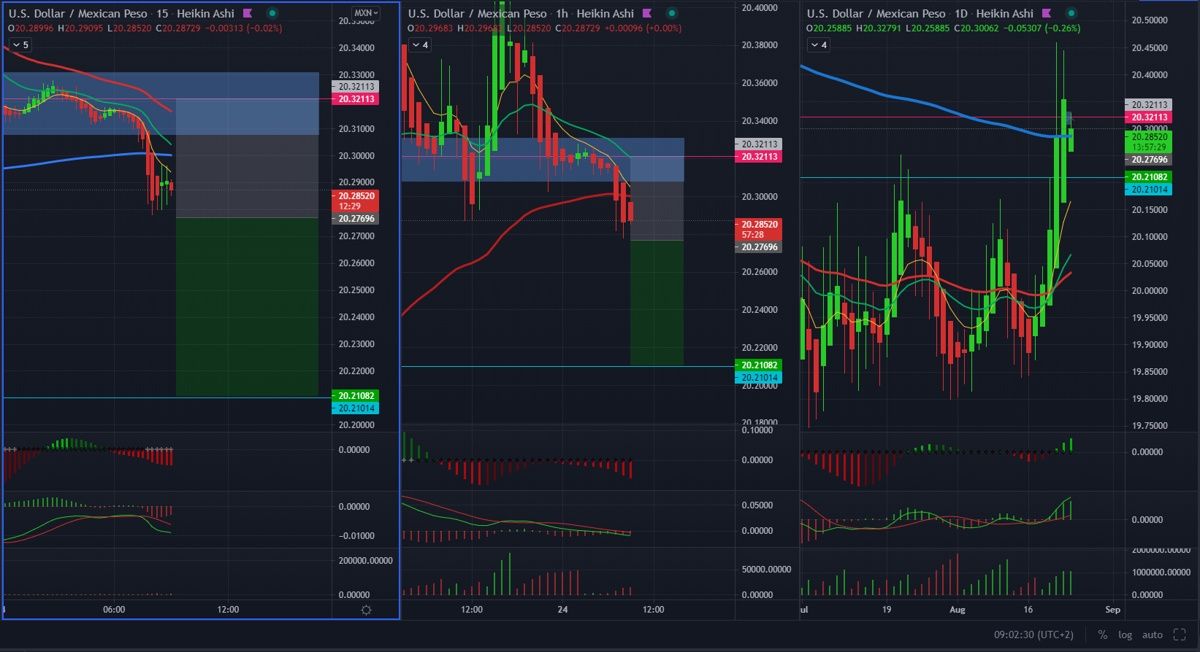
Daily 8EMA Gap on USDMXN
Good Morning, Just saw this little gap on USDMXN. We will have to patiently wait for a BCR+C of the 200EMA on M15. It already started to retest. It may get a little higher to the zone though. Once the retest is fully formed and the C starts, the SL may be optimized to ABOVE the retest high. https://gyazo.com/fd4eba17584e66288c68e0ddfc985ca6 Continuation may be in M5, but in any case, the Sniper criteria needs to be on side in M15 and H1! RR: estimated 1:1,5. Trade safe, risk accordingly. Good luck.

USDMXN Long
Pair Accumulated followed by bullish momentum as expected. We now have a retracement to origin to mitigate Sell orders at BuOB. Expecting continued bullish momentum upon mitigation. Entry confirmation is HLs on LTF at entry
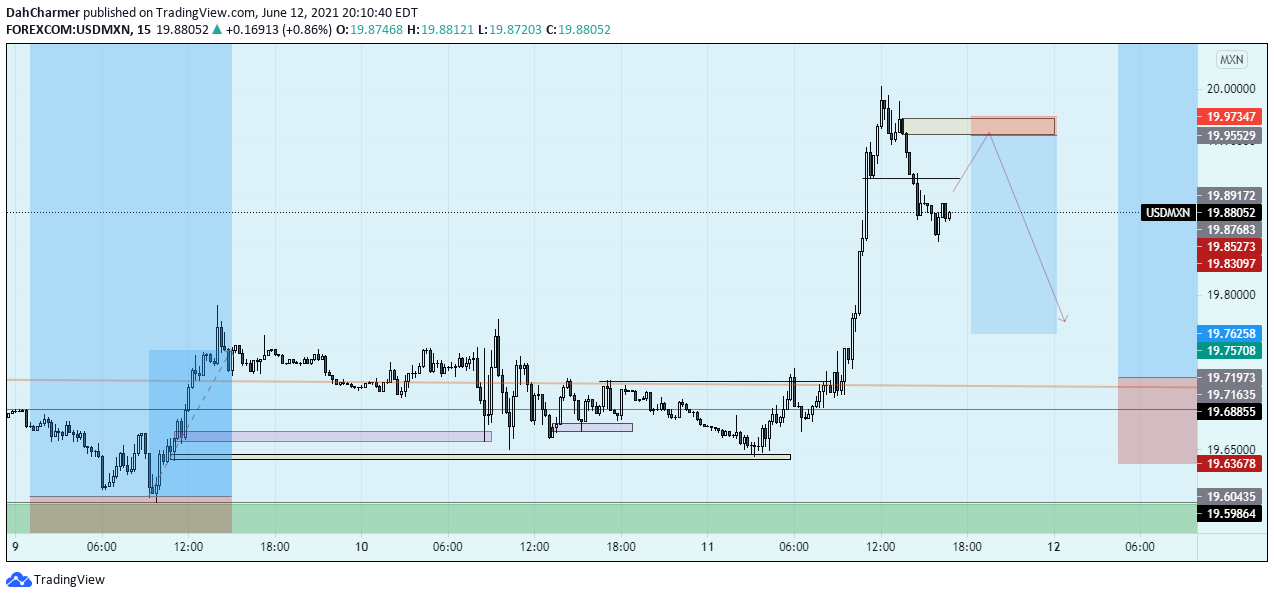
USDMXN Short
We have a sell model on the LTF to ride the retracement into our Long POI. Price have broke major structure to the downside, leaving behind unmitgated inefficiencies in price. 5min BeOB identified as POI for continuing Shorts.
USDMXN Long
The pair tapped nicely into our bullish Daily OB and rejected as expected. Looking for another entry on the retracement to the origin of the move for continuation.
USDMXN Long
After bullish expansion from Consolidation, price is (RTO) retracing to mitigate the Bullish OB that originated the move. We can expect bullish momentum to return at this level. Always wait for Shift in market structure on the LTF for entry on the retracement.

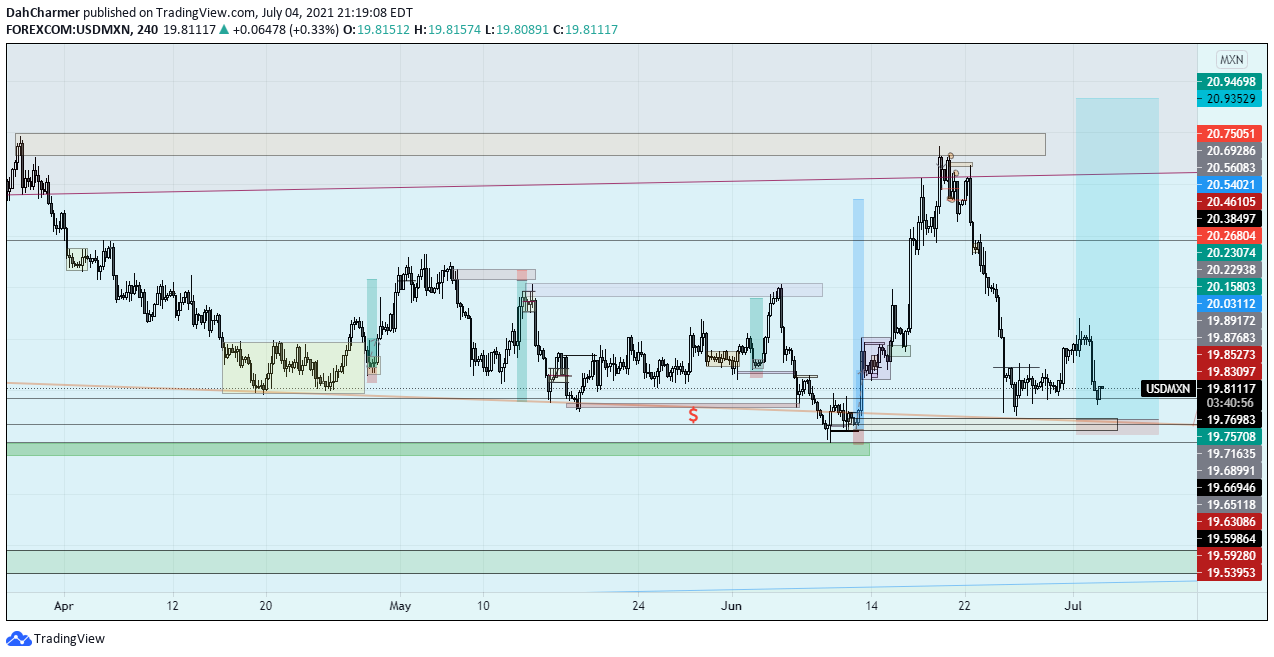
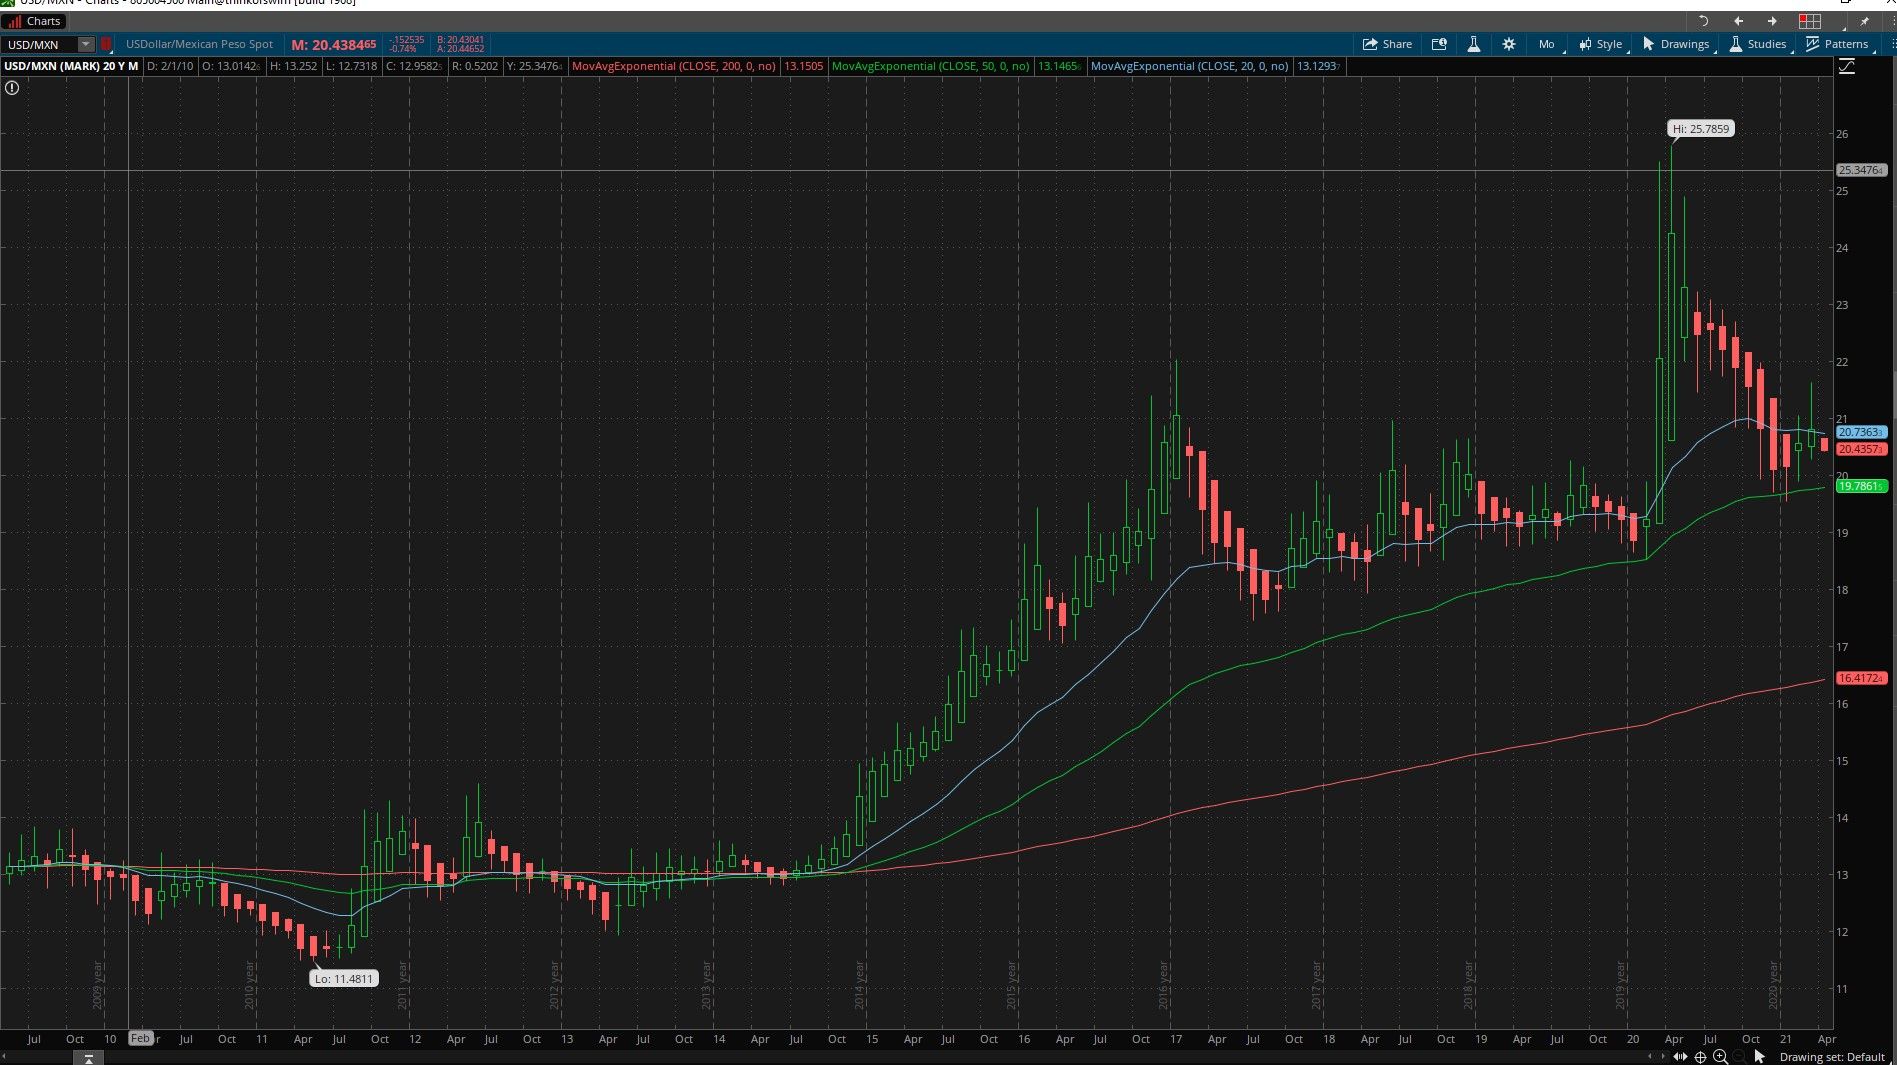
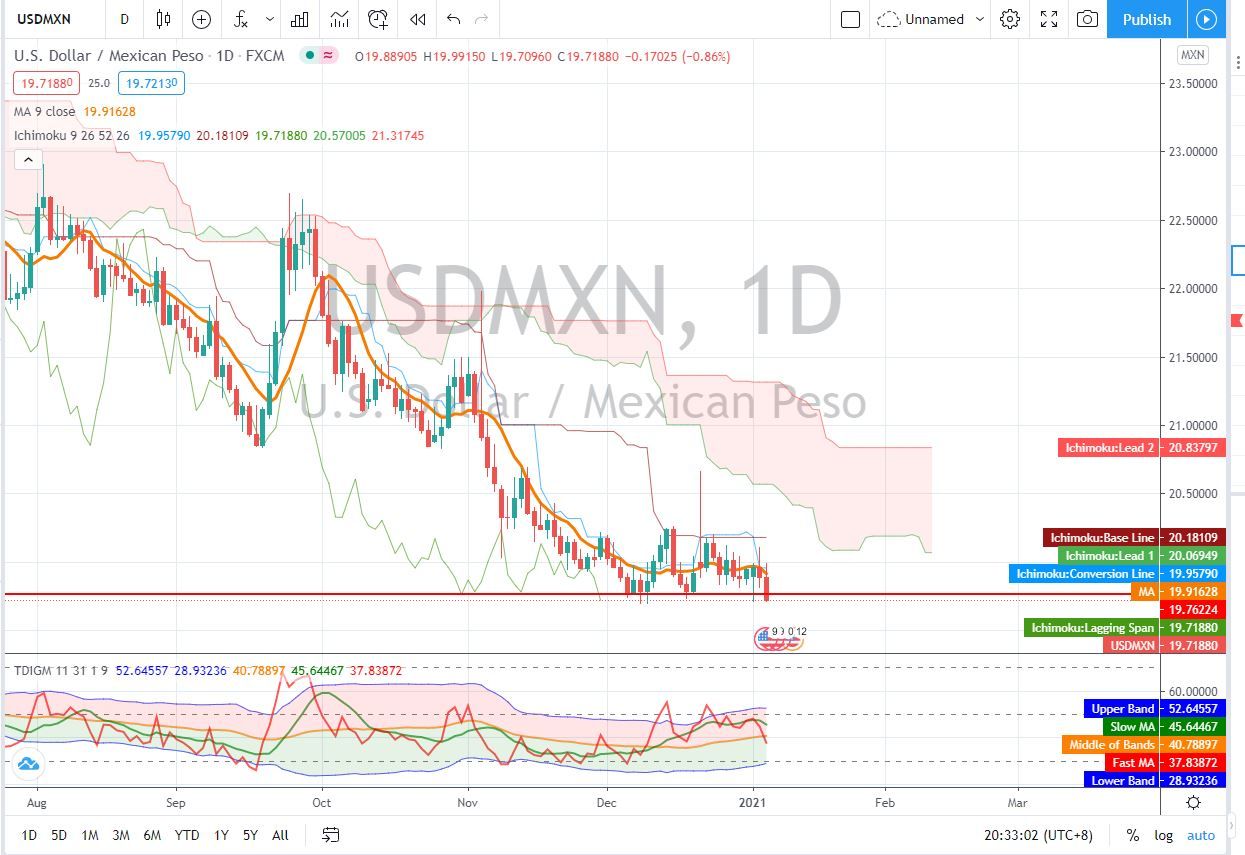
Now may be a time to invest in Mexico, especially with not taking on further debt...
That being said, this is really more technical and trying to catch a falling star. I believe that USD MXN will go further down. I issue the monthly chart to show that it has gone below the 20 EMA. Although, there are past transgressions below this line, the level that I am looking at is to touch the Monthly 50 EMA or slightly above it. It may go further down, but it is strongly possible to rise up. If you look at 1 hour, the other TP that is earlier to touch than this one, I believe is 20.35047. But that's awfully quick. My thesis is that since on the on hour we are seeing it below all three EMAS, that this time, would be the time for it to move down further. The TP I put here is based of the Monthly chart, and I believe that it will reach level. Please let me know what you think.

USDMXN 1H 50/200EMA GAP CLOSE
Wait for 1H BCR 50EMA, continuation on the 15M, down to the 1H 200EMA Thoughts please...
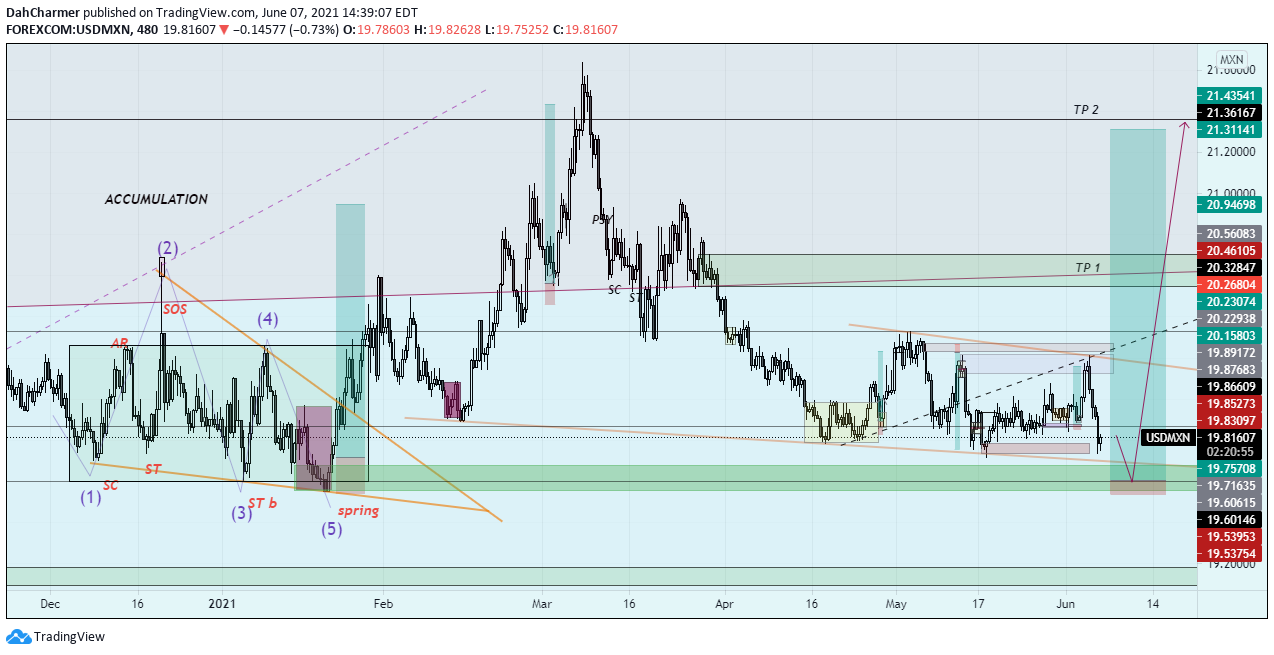
USDMXN Long
Price just completed a successful Wyckoff Accumulation confirmed by the break out of the range. Price PB to support 50% of the range, forming a LPS where bullish momentum followed. Added confluence is perfect Wolfe wave symmetry along with bullish flag. Get in on the PB. Check all the boxes for me (except neg swaps). Do not follow blindly.

Sell off on the USD
Pushing through support here , time to look at at this one
Brake of major support
Waiting for the daily candle to close beneath support. Retest and continuation down south to about 20.2000. Can be a big move. I am pretty new to this so don't follow blindly.

USDMXN strongly bearish
USDMXN looking bearish with bearish short continuation pattern this should head down good luck and happy trading. Risk accordingly good luck and happy trading
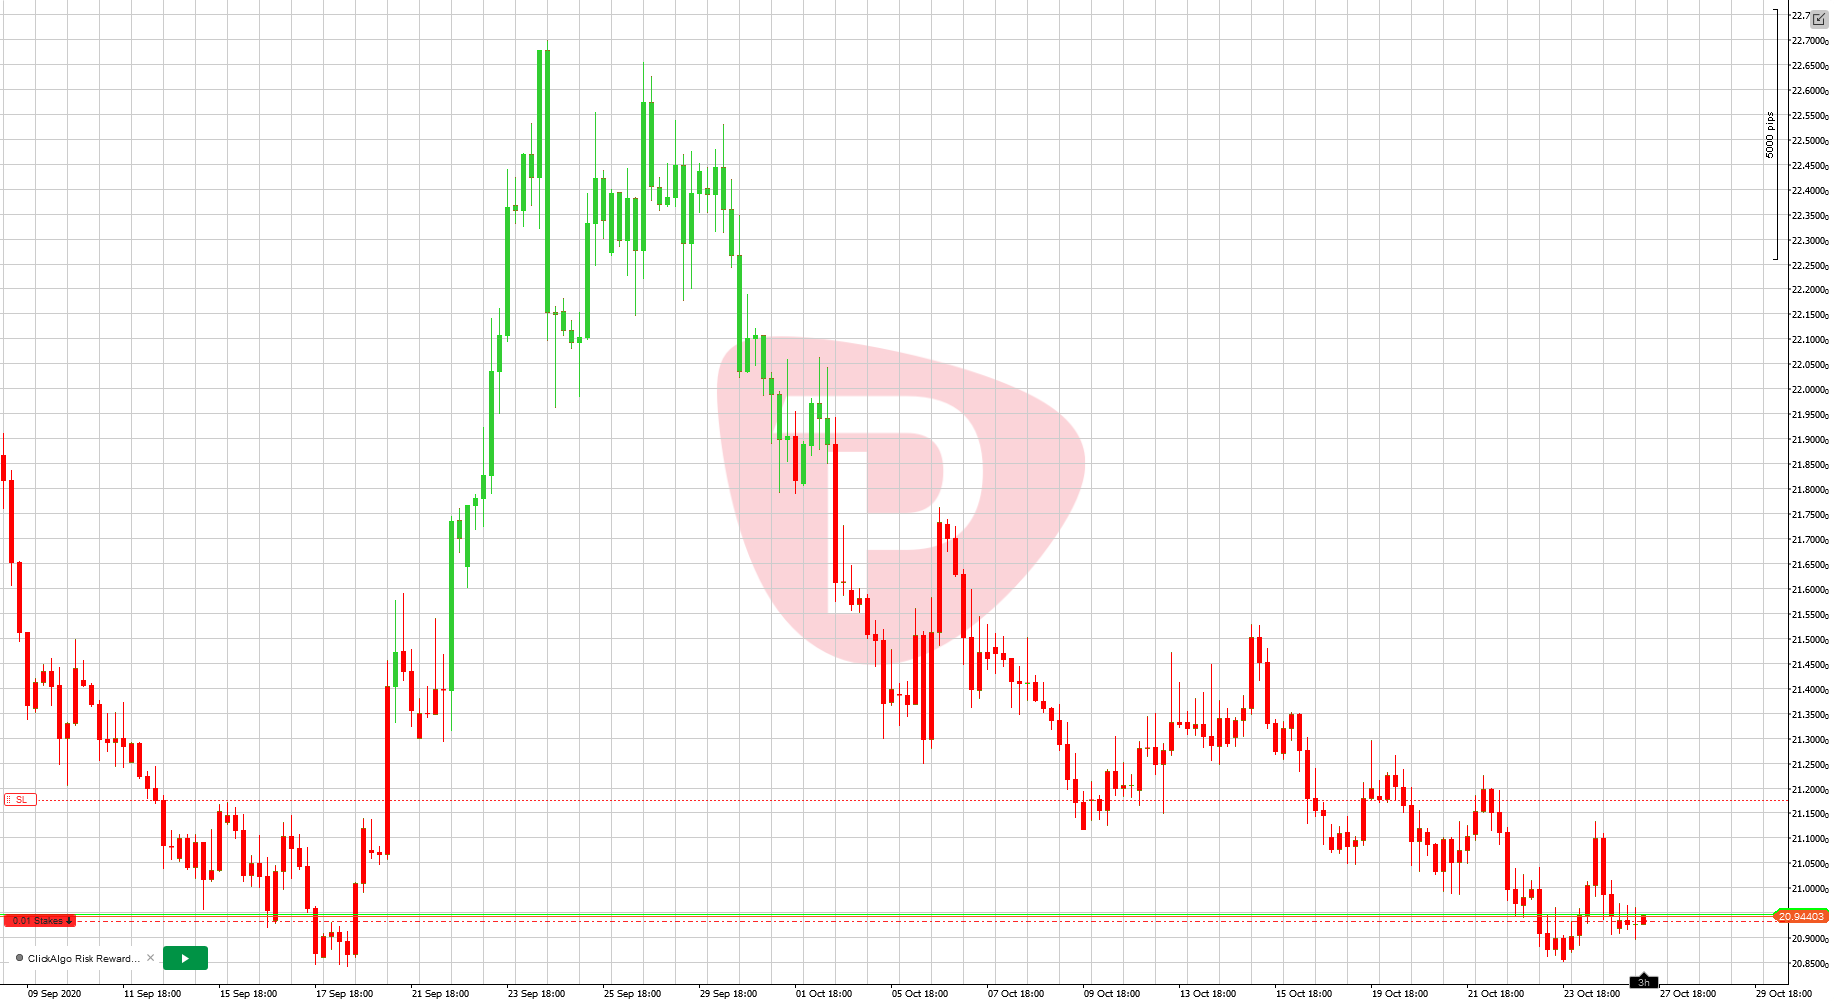
BCR of Supply and Demand Zone
TIP AND RUN STRATEGY 4 HOUR CHART BCR OF SUPPLY AND DEMAND ZONE PAIR : USDMXN SHORT ENTRY : 21.30459 STOP : 21.49230 TP : 20.95035 SET AND FORGET : * EXIT = TP HIT or STOP HIT

USDMXN Short
USDMXN is firing to the downside, if you are not already in then wait for a pull to the entery. Good luck!

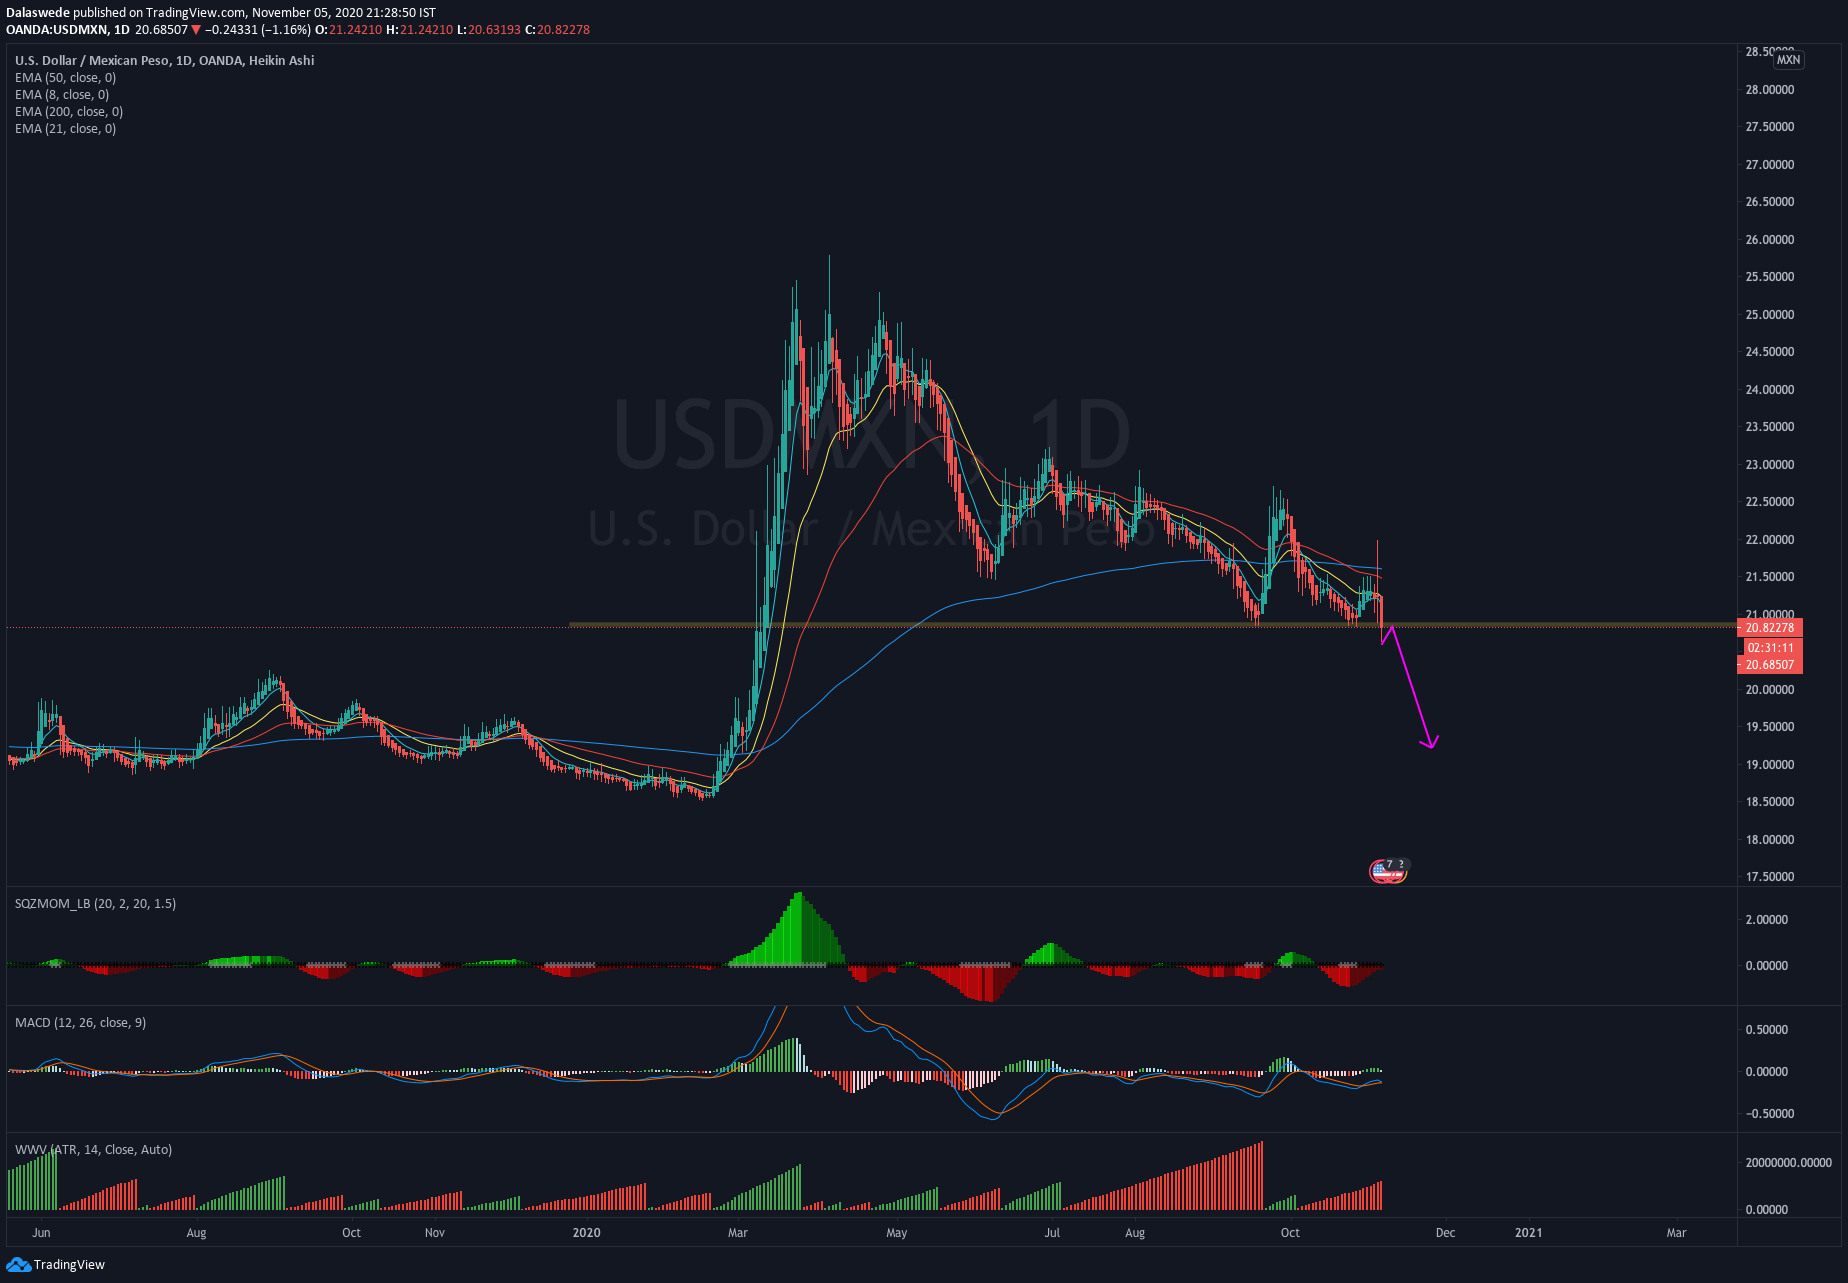
One from the watchlist (Sniper)
Got what we were waiting for on the watchlist which was a BCR of the supply and demand zone, we also got a daily BCR of the 200 EMA - all signs point to a downward move DAILY BCR of 200 MACD crossed WWV red Squeeze red 4H Breakout of descending channel WWV red MACD crossed Squeeze red POLR downside 1H BCR below bottom of channel BCR below S+D zone Closed below 8EMA WWV red Wait for a couple more continuation candles before entering. Approx 1.4 RRR #DontFollowBlindly

surely the POLR is to trade between the daily emas 50 to 200.. if you enter below where we are now then youll be below 4hr and 1hr emas, aswell as having the momentum away from the retest of the 50 all in your favour

Please wait for another bullish candle to close to confirm bullish momentum and execute longs to target. This is another daily 8GC opportunity, Good luck.

A- Weekly bearish & Broke the anchor on the daily 22.85990 1-Broke a major S/R on the 23.28616 level and retested it. 2-Broke the anchor of the 22.85990 of 4H as well 3-Golden cross on the 4H 4- 50.ish % pullback Entry: Wait for the pullback before entry - plus any confirmation sign, its a pullback in order not to get mixed with a reversal as the USD is getting some strength. RR: 1 Tp1: 22.40771 Tp2: 22.16683 Sl: 23.25049 This is my point of view, please do your own analysis & Trade safe! #DontFollowBlindly
Breakout of key level for next week: - Search for sells on H1 until levels 22.2200 and 21.4037 - Sell on daily with TP on 22.2200 and 21.4037 in extension.
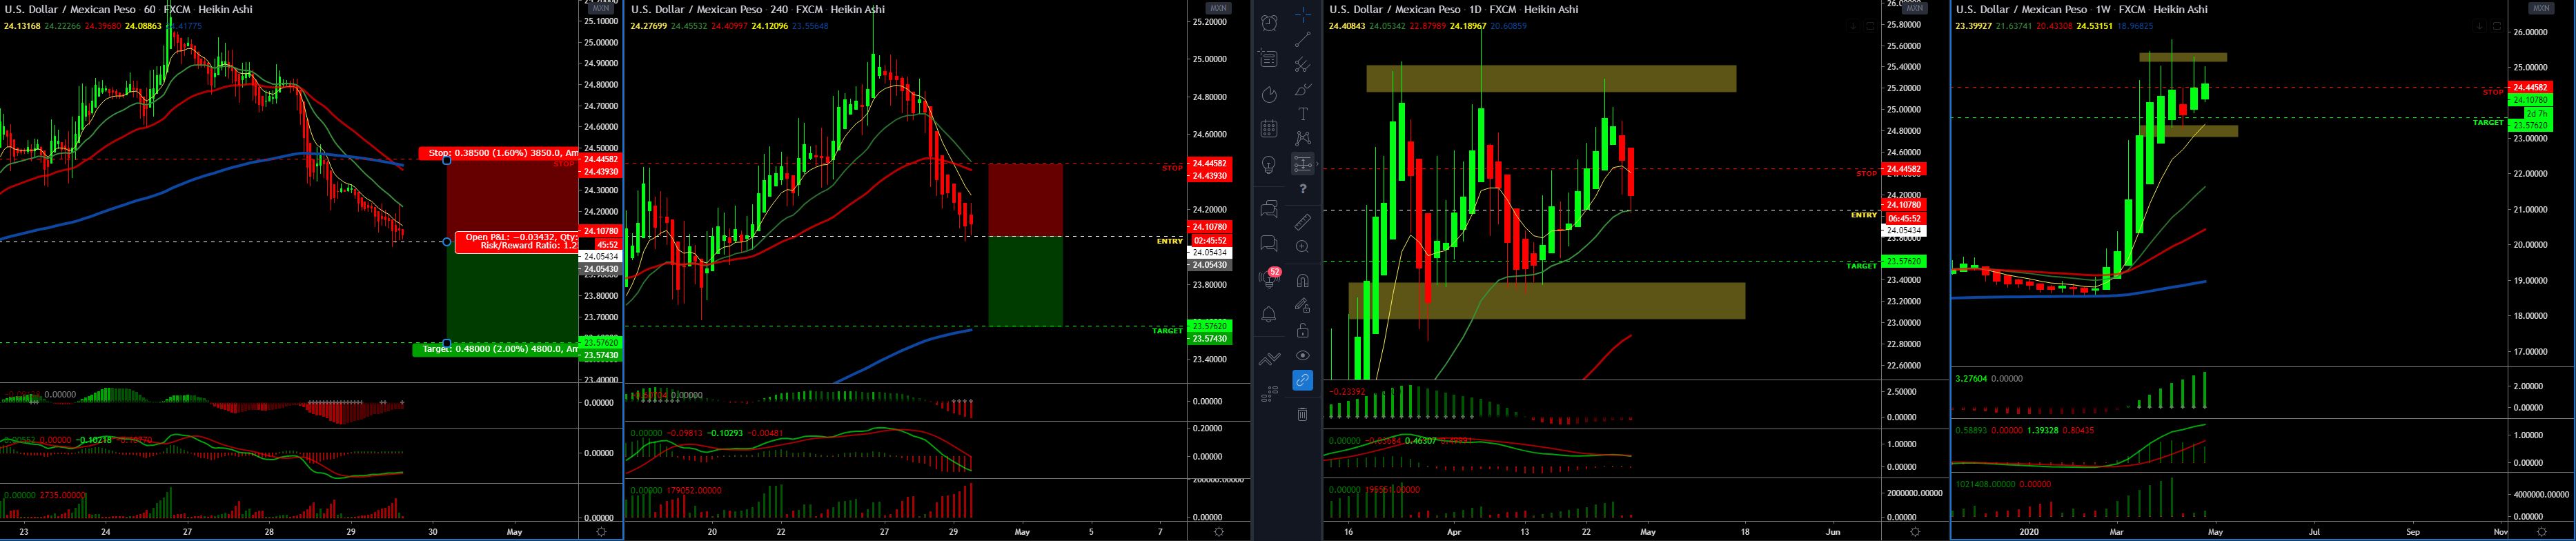
WEEKLY GAP CLOSE SELL Stop - 3390 pips Target - 5251 pips Risk / Reward Ratio - 1.54 Weekly 8EMA gap Momentum to upside slowed down Lower high Daily All 3 indicators onside for a sell Bounced from resistance 4H All indicators onside for a sell Targeting 200EMA 1H BCR of 200EMA confirmed Pull back and rejection from 21EMA Death cross confirmed All 3 indicators onside for a sell Decent risk reward - Check your spreads and lot size. Risks: 1. 8EMA gap on 4H (covered by stop) 2. 21EMA on daily to combat Exit Strategy: Close if price closes above 200EMA on 1H (for a loss) Close if weekly gap is closed before we hit tp (for a profit) #DontFollowBlindly

USDMXN - Weekly Gap Close - Ignore Entry Level Weekly Chart - Price has risen (to it's highest ever point since 2003) and extended away from the 8EMA. Price has made a series of lower highs. Daily Chart - Price has broken below the 8EMA. Red/Green on the MACD with the start of red histograms on WWV. 4H Chart - Price has broken and closed below the 50EMA but extended from the 8EMA. What we're looking for to take the trade: (1) 1H Chart - Price to close the 8EMA Gap (2) 4H Chart - Price to close the 8EMA Gap (3) Indicators to be on side. Once the above are realised, target profit will be 23.56956 just above the 4H 200EMA. There may be possibility of further shorts on this pair but let's first close the gap. Please note this is my interpretation of the chart and should not be followed blindly. Good luck and trade safe.
A- Weekly & Daily uptrend B- US dollar is showing some strength. C- This is a tricky trade, explanation in the entry. 1- Broke the anchor on the 24.21365 level and showed price acceptance. 2- EMA's fanned to the upside nicely on the 1H-4H 3- Strong bullish momentum on the 4H. 4- Possible rising three patterns, and bounced back from the trend line. 5- Broke & Testing the anchor on the 24.41286 level. Entry: 6C- this trade is ranging between the S/R zone. 7C- tested the anchor on the 23.70913 level and bounced back to the upside. 8- Waiting for the BCR on the 1H to be closed and retest the 24.45870 level. RR: 1.28 TP1: 24.66560 previous high anchor TP2: 25.1065 precious highs SL: 23.96789 previous lows This is my point of view, please do your own analysis & Trade Safe! #DontFollowBlindly

tp is first h8 positive pip close above the 8 ema sl is price acceptance above the 8 ema see marks trading lab module 6 for explanation of price acceptance
USDMXN - Weekly 8EMA Gap Close (ignore Entry Price above). Weekly Chart - Price has extended away from the 8EMA. Daily Chart - Price is weakening. 4H Chart - confirmation that price is weakening. Red/Green on the MACD, Red Histograms. Momentum softening on the momentum indicator. Wait for price to B&C below the Daily 8EMA. TP at 22.54088, SL at 25.32976. Entry price to be determined by the break and close.
Online
Nick Quinn
X5+ years experienceNick has been trading since 2008. He has experience trading equities, fixed income and commodities. However, his preference is spot market foreign exchange, his style is big picture macro position trading in CFD’s and currency futures contracts.
Max Norbury
X10+ years experienceMax is a diligent and pro-active individual with a wealth of experience in technical and fundamental analysis, high-probability trading and mentoring within the financial markets. He has also has a variety of non-accredited analytical certifications.
Shain Vernier
X10+ years experienceShain is based in the USA and has over 10 years of experience in the markets.