Other Top Trading Posts

NZDUSD Raising Wedge


Big Move for GBP/CAD?

BIF - Long Trade (It's been a while!)


Down Trend Continuation

Down Trend Continuation

4h Chart Up Trend Continuation


H&S on NVIDIA daily chart


3M and 5M chart for entry, 30M chart for session direction


EURJPY H&S


EURUSD returns to 50% retracement on 1h time frame


Naked on NZD JPY

Naked AUDCHF

Up Trend Continuation
Down Trend Continuation

Daily Chart Up Trend Support Level Test

Up Trend Continuation

USDCAD BUY OPPORTUNITY ?
Up Trend Continuation After Pullback

EURNZD POTENTIAL BUY

GBPAUD BULLISH

EURUSD BEARISH


Hi Nick , can you please have a look at my post in market analysis

Down Trend Continuation

Up Trend Support Level Defense
Top trade ideas
Get Trade Feedback
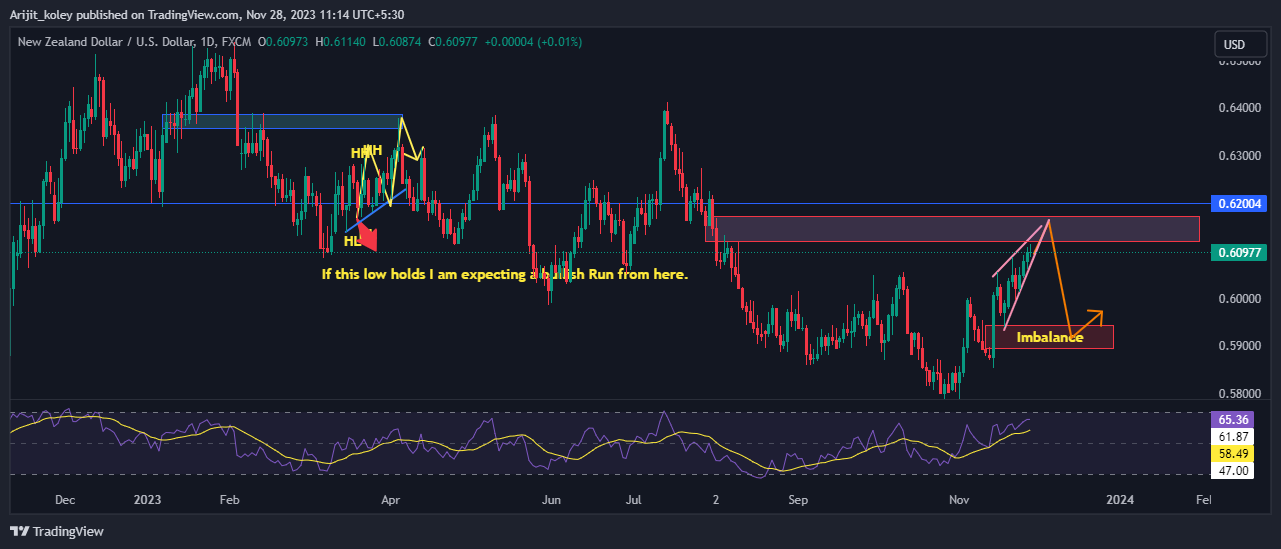
NZDUSD Raising Wedge
We've identified a rising wedge pattern on the Kiwi, and it appears to be under pressure. While the direction is uncertain, upcoming news is likely to influence it. I'm taking a short position, anticipating a potential 150-pip drop.

Naked trade set up
Enter trade in two parts for two exit strategy. if TP1 is hit, move stops to break even on the 2nd part.= with TP 22 set at 1.0650. Watch the naked trading modules for clarification on strategy rules.


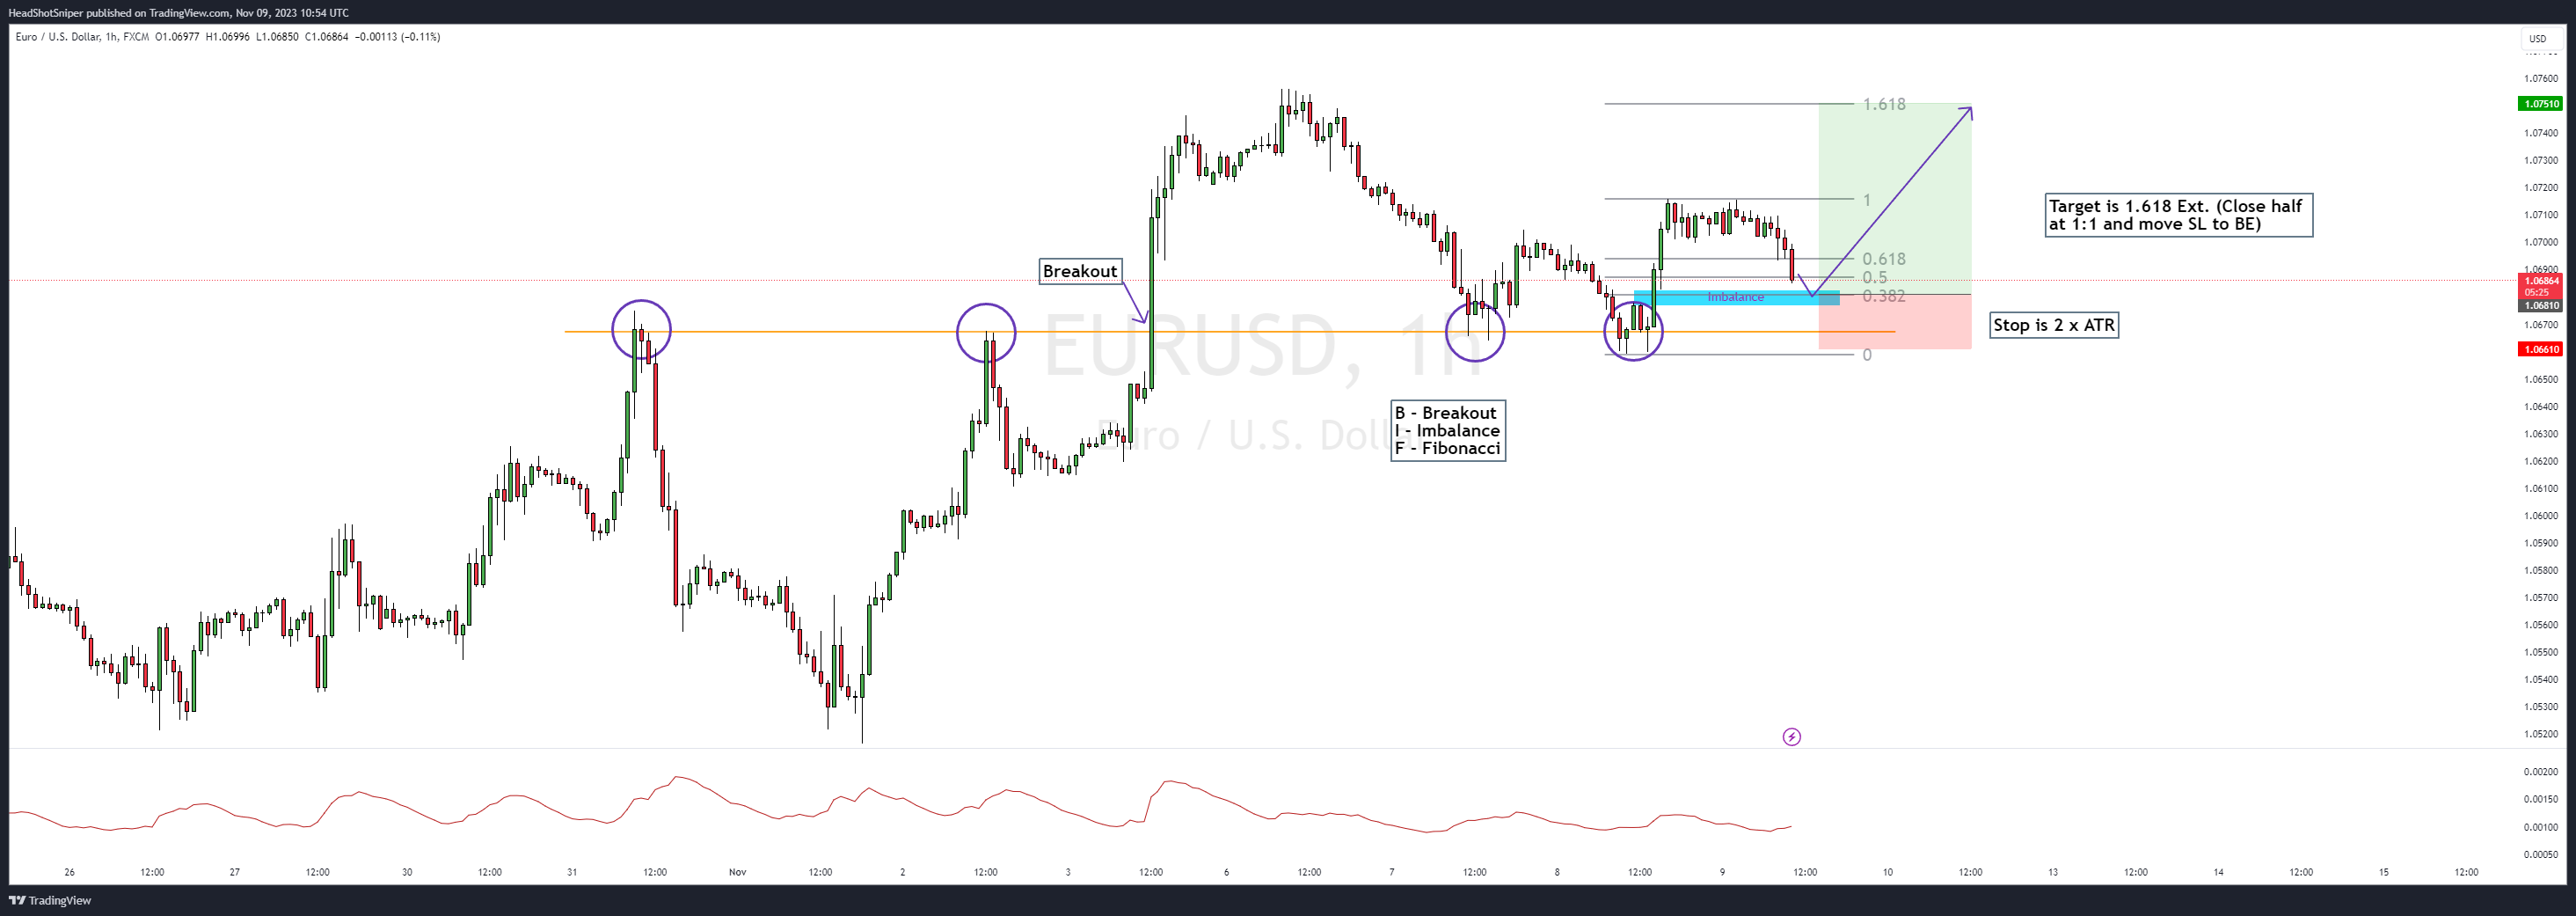
BIF - Long Trade (It's been a while!)
B - Breakout I - Imbalance F - Fibonacci Stop is always 2 x ATR Close half at 1:1

Down Trend Continuation
weekly chart head and shoulders is forming new daily chart down trend as of yesterdays close sl is daily chart close above the November 1st high tp is 1 times the sl
Down Trend Continuation
sl is the daily chart closing price above yesterdays high tp is 1 R head and shoulders on the daily chart and new 4h chart down trend
4h Chart Up Trend Continuation
sl is daily chart closing price below todays lows tp is 1R from todays lows

H&S on NVIDIA daily chart
Keep an eye, the 7's are getting weaker and there's a nice gap to be filled at $320

3M and 5M chart for entry, 30M chart for session direction
Best advise ever from Alexa aka Jenni, "trade what you see". I stopped overthinking fundamentals and got up early to trade London open, Tokyo close. Smoother moves, higher win rate. Will hold position until 30M chart tells me to get out https://gyazo.com/ee9d2a613f31c9107dc600c58596de18

EURJPY H&S
Head and shoulders pattern in the EURJPY chart, 1H time frame looks bearish. MACD also looks like a bearish divergence. Going short on this one.

EURUSD returns to 50% retracement on 1h time frame
EURUSD recently made a rare Higher High and has now returned to 50% fib level, coinciding with a rising support channel. Good place for entry with a reasonable tight stop loss below the .618. 1st TP at the previous high. Alternatively, the Head and Shoulders pattern could point to it going the other way, Although WW3 fundamentals could send it down at any moment, on the technical side I can't see any reason not to do this, so any feedback would be appreciated.

Naked on NZD JPY
Naked opportunity on NZDCHF ENTRY (two entries) : 0.52252 SL: 0.51700 TP1: 0.52705 TP2: 0.53150 Trade accordingly, manage your risk, don't over expose yourself, know your strategy!
Naked AUDCHF
Naked opportunity on AUDCHF ENTRY: (Two entries) 0.56600 SL: 0.56100 TP1: 0.56900 TP2: 0.57300 Trade accordingly, manage your risk, don't over expose yourself, know your strategy!
Up Trend Continuation
Recent daily chart up trend with pullback sl is 10 pips below yesterdays low tp is the same number of pips as the sl
Down Trend Continuation
sl is daily chart bar close above yesterdays high tp is 1.5 ATR(14) of the daily chart
Daily Chart Up Trend Support Level Test
sl is bar close above the current daily candle high tp is 1 ATR (14) of the daily chart
Up Trend Continuation
sl is daily bar close below the previous bar low tp is 1.5 ATR (14) of the daily chart

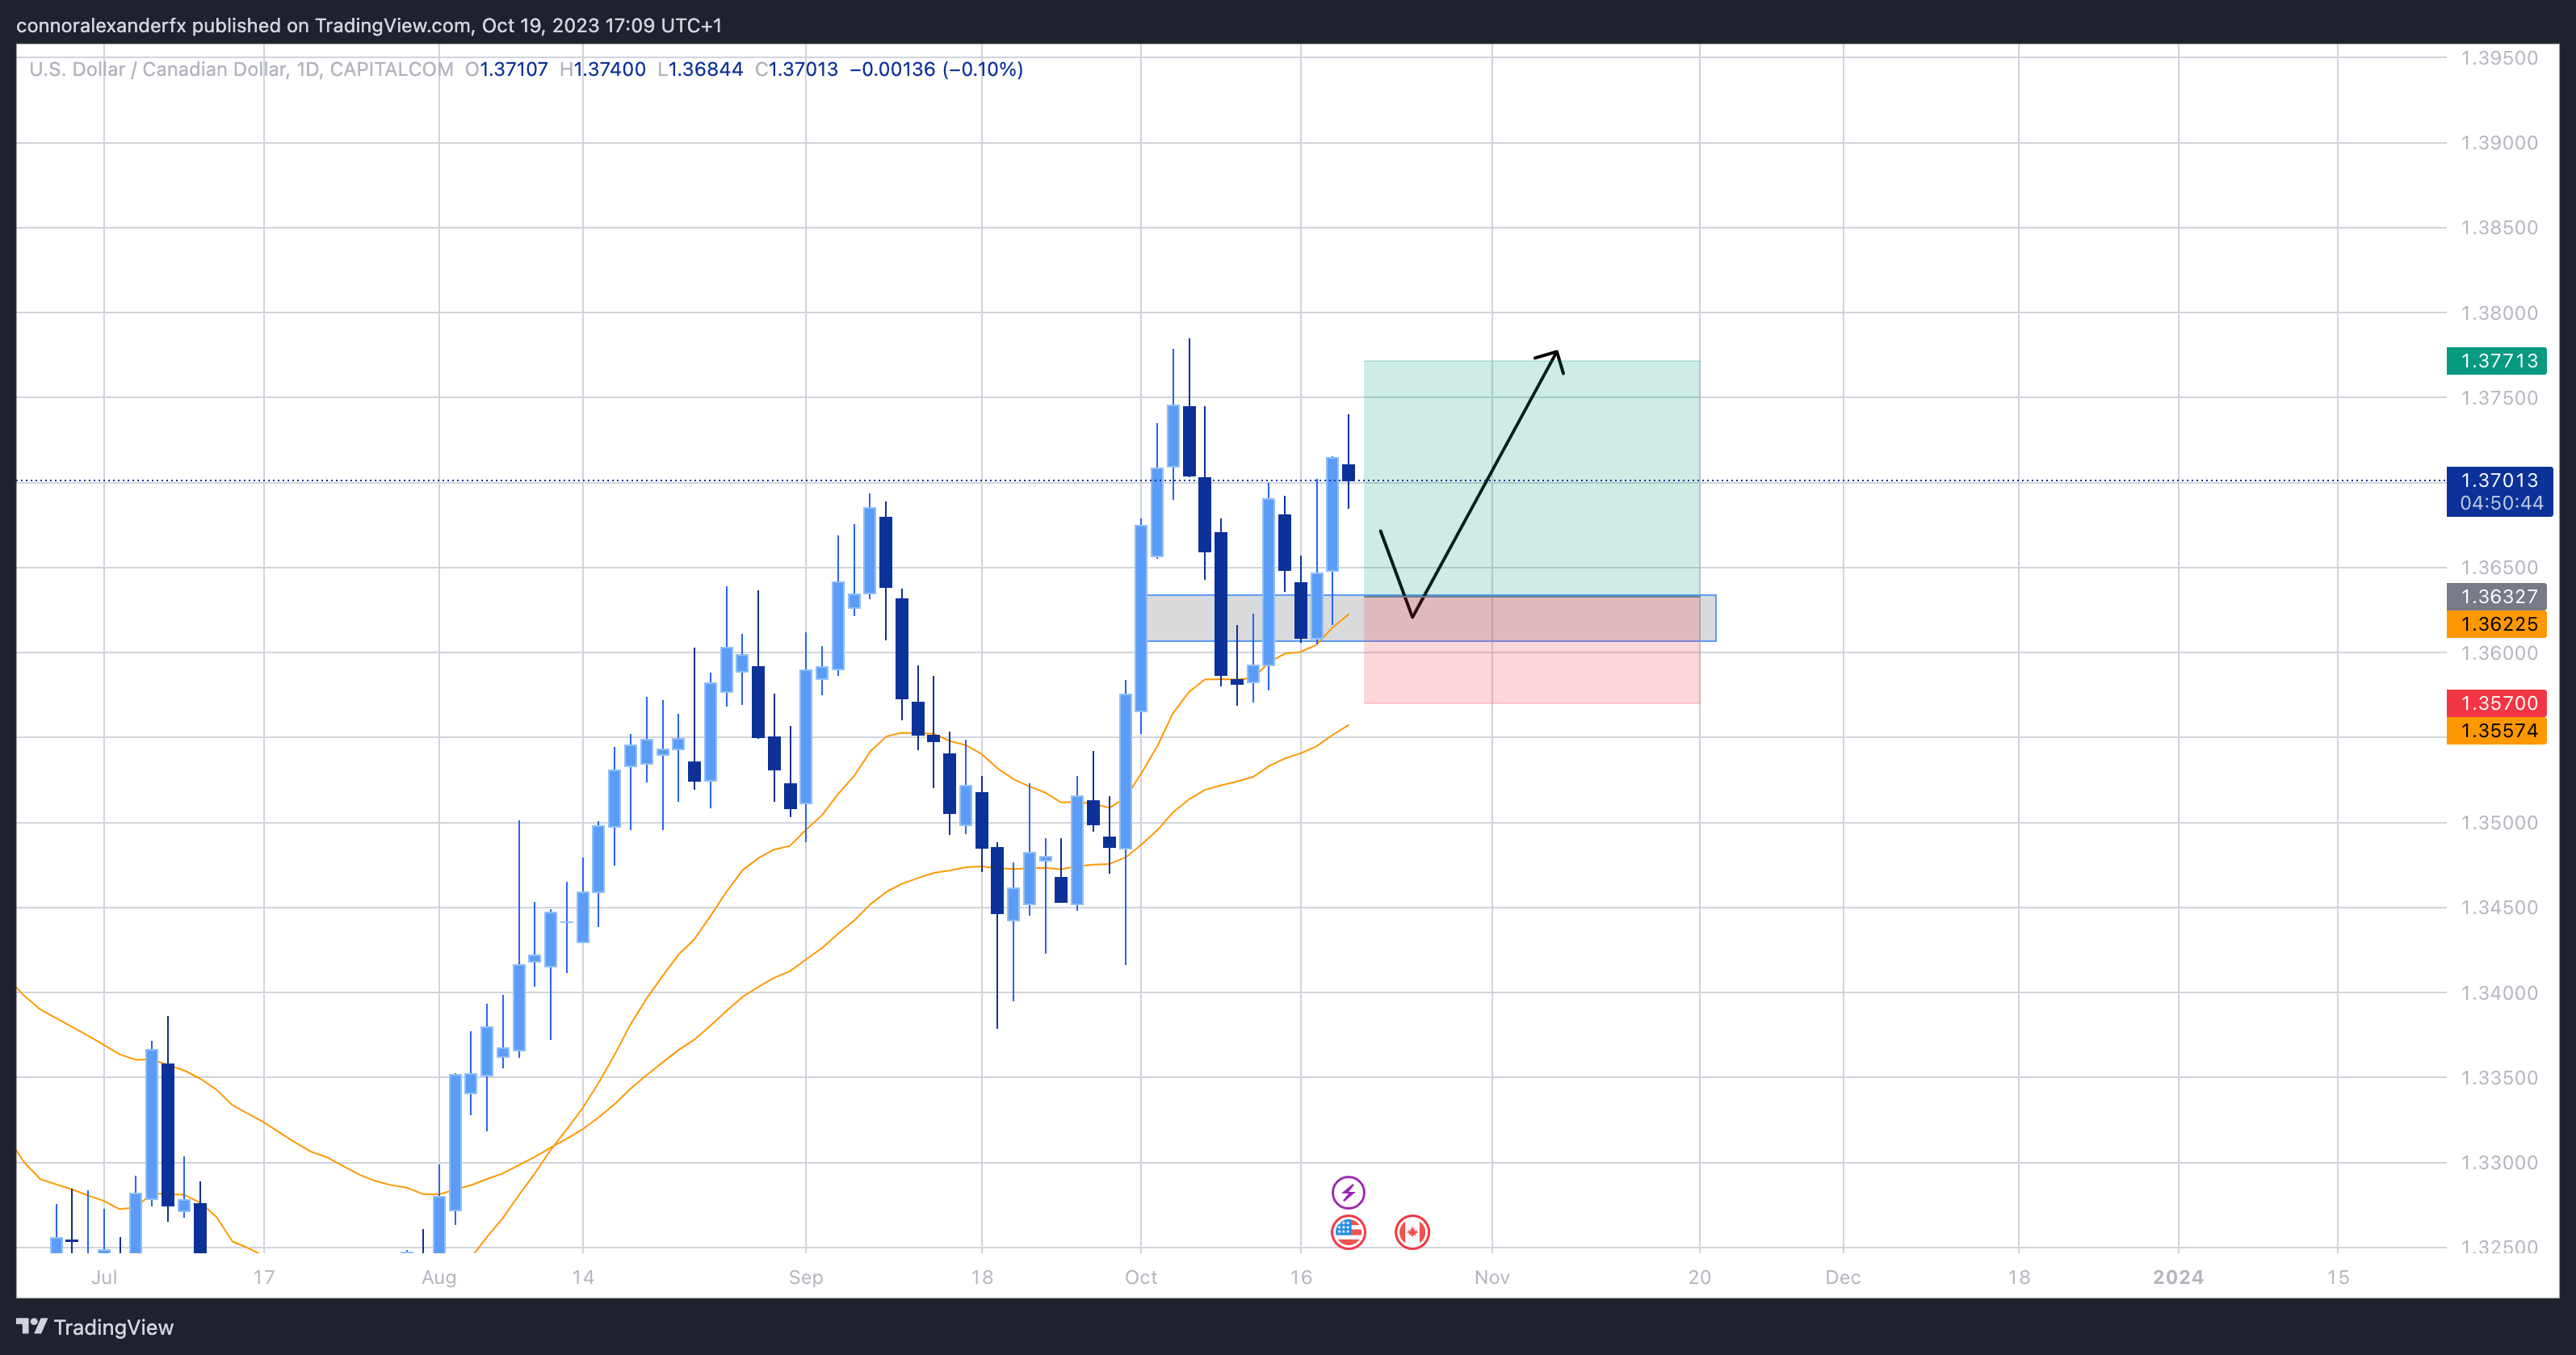
USDCAD BUY OPPORTUNITY ?
USDCAD looking like it has some upside potential here on the daily
Up Trend Continuation After Pullback
Buy if gbpaud pulls back to the daily chart up trend support level with 1 ATR(14) sl and 1.5x for tp
EURNZD POTENTIAL BUY
waiting for price to pullback into the golden zone on the fibonacci . if price respects structure then this could be a nice little trade gaining 60 pips from the 0.618 up to to the 0 top line of the fib. 1:5 RR. reasons why taking the trade - bullish trend on the 4hr , 1 hr and 15 minute making higher lows and respecting structure .
GBPAUD BULLISH
could be a good buy opportunity here . bullish trend , respecting ema's and touched the 50 zone on the Fibonacci .
EURUSD BEARISH
whats your thoughts people ? i'm thinking EURUSD BEARISH at the moment .

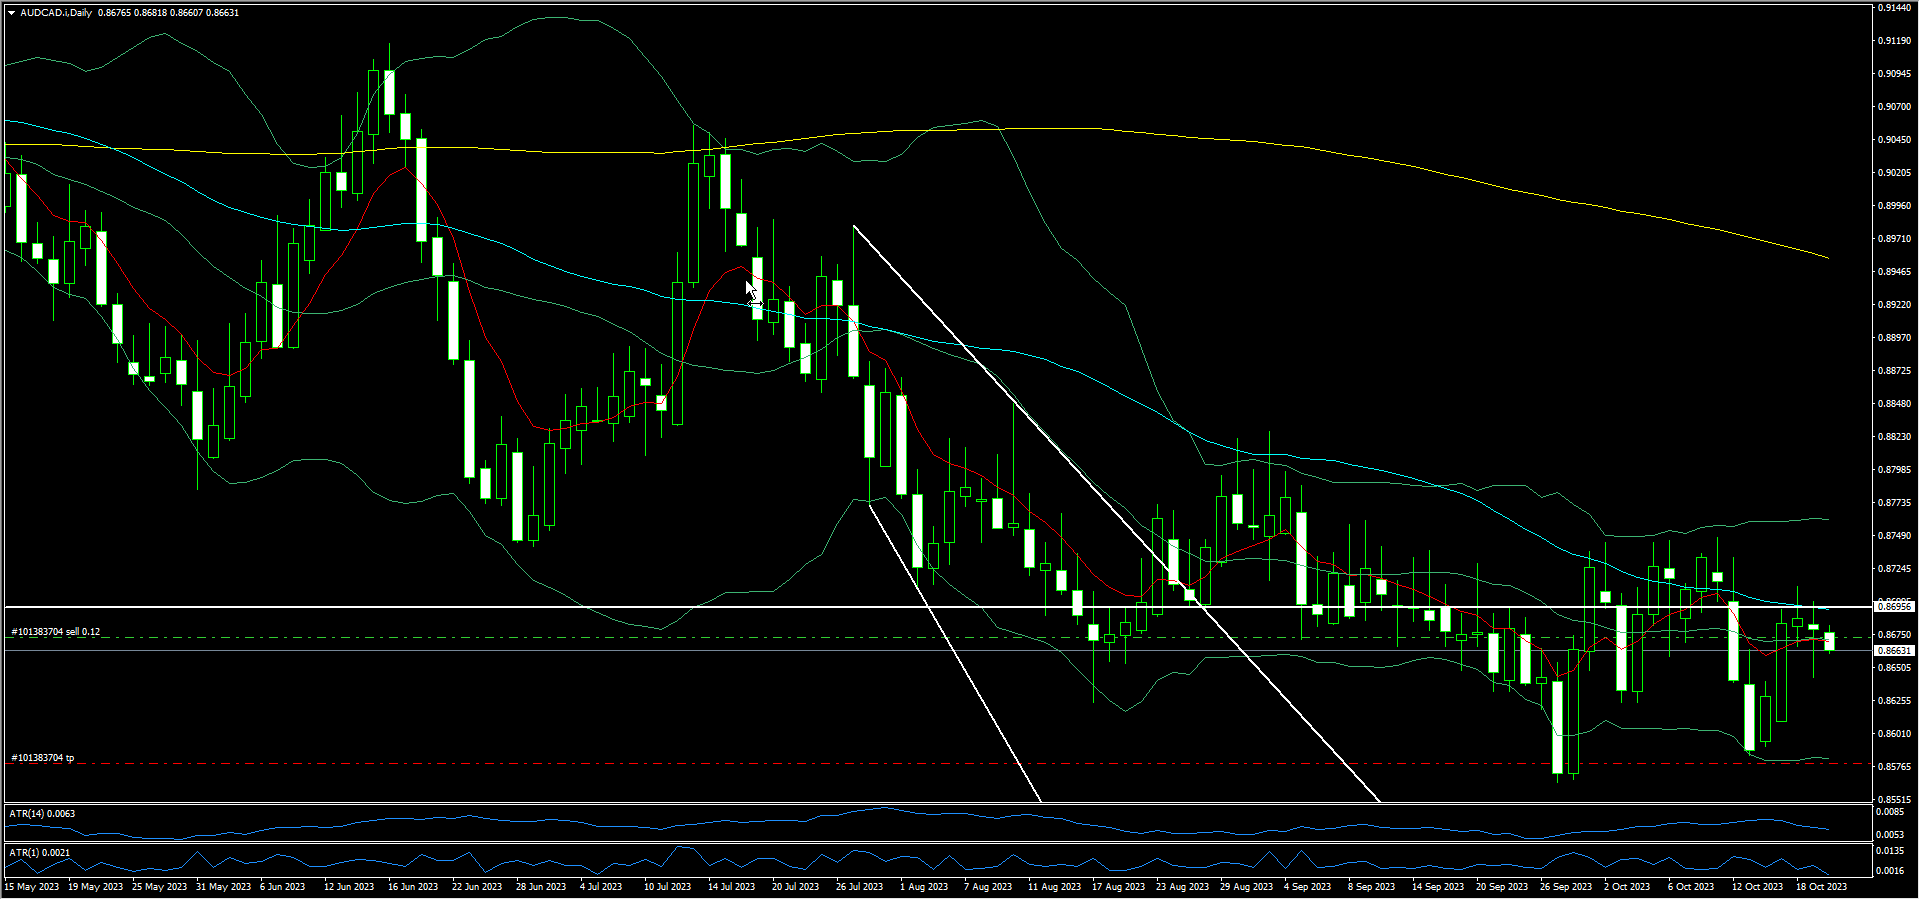
Hi Nick , can you please have a look at my post in market analysis
i plotted this trade idea back in Aug, is it still valid today
Down Trend Continuation
sl is first daily chart time frame close that is not below the low of the previous bar tp is the same as the sl
Up Trend Support Level Defense
sl is 1 ATR(14) tp is 1.5 ATR(14) both of the daily chart
Online
Nick Quinn
X5+ years experienceNick has been trading since 2008. He has experience trading equities, fixed income and commodities. However, his preference is spot market foreign exchange, his style is big picture macro position trading in CFD’s and currency futures contracts.
Max Norbury
X10+ years experienceMax is a diligent and pro-active individual with a wealth of experience in technical and fundamental analysis, high-probability trading and mentoring within the financial markets. He has also has a variety of non-accredited analytical certifications.
Shain Vernier
X10+ years experienceShain is based in the USA and has over 10 years of experience in the markets.