-
Trading Room
-
Join the leading trading room
You need tested strategies, powerful tools, and experienced traders to arm you with knowledge.
Start free trial - Trading room
-
Join the leading trading room
-
Education
-
Join the leading trading room
You need tested strategies, powerful tools, and experienced traders to arm you with knowledge.
Start free trial - Education
-
Join the leading trading room
-
Strategies
-
Join the leading trading room
You need tested strategies, powerful tools, and experienced traders to arm you with knowledge.
Start free trial - Strategies
-
Join the leading trading room
-
Free Tools
-
Join the leading trading room
You need tested strategies, powerful tools, and experienced traders to arm you with knowledge.
Start free trial - Free Tools
-
Join the leading trading room
-
Company
-
Join the leading trading room
You need tested strategies, powerful tools, and experienced traders to arm you with knowledge.
Start free trial - Company
-
Join the leading trading room
Pivot point calculator
Not sure how to find Pivot Points on your chart? Use our advanced Pivot Point Calculator and find the significant support and resistance levels in a matter of seconds.
Go to calculator
How does the pivot calculator work?
First, traders can select from five different Pivot Point calculation methods: Floor, Woodie, Camarilla, Tom De Mark's and Fibonacci.
The difference between these methods is the number of levels considered and displayed:
For instance, let us calculate pivot points for GBP/USD for the next trading session using the Standard (Floor) method and adding the previous period's data.
High price: Here we will type in the highest price that the GBP/USD pair reached on the previous trading session, for example, 1.30452.
Low price: Now, we will type in the lowest price that the GBP/USD pair reached on the previous trading session, for example, 1.24651.
Open price: Here, we type in the closing price for the GBP/USD pair on the previous trading session, for example, 1.25255.
Close price: Finally, we type in the closing price for the GBP/USD pair on the previous trading session, for example, 1.26254.
* This is an educational tool and results should not be construed as investment advice.
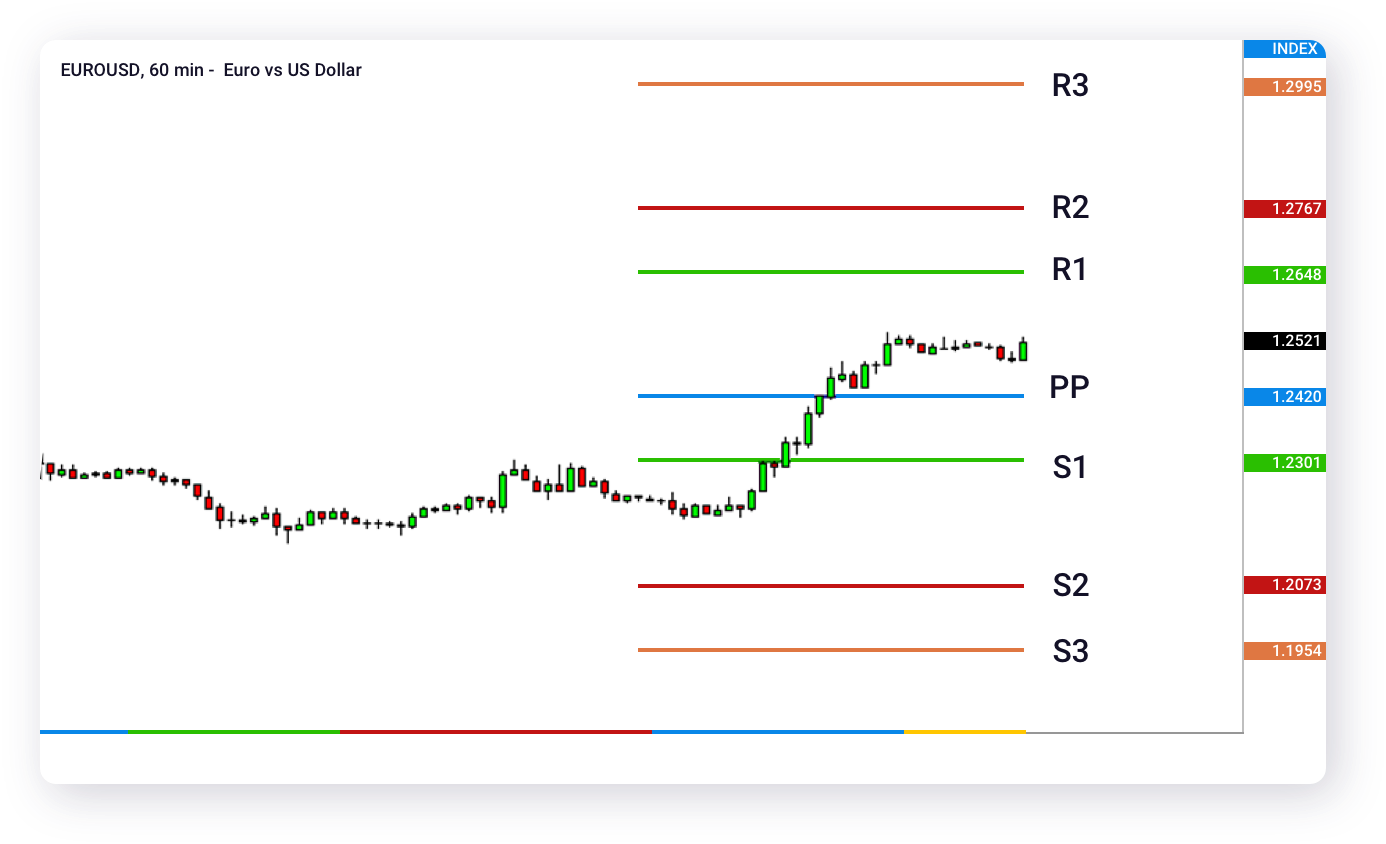
Understanding Pivot Points
Standard (Floor)
The floor Pivot Points, also known as Classical Pivots and are the most basic and popular type of pivots used in Forex. These floor Pivots are price-based support and resistance levels and are calculated using a prior period's high, low, and close prices.
R1 = (2 x Pivot Point) - Low (previous day)
S1 = (2 x Pivot Point) - High (previous day)
R2 = Pivot Point + (R1 - S1)
S2 = Pivot Point - (R1 - S1)
R3 = Pivot Point + (R2 - S2)
S3 = Pivot Point - (R2 - S2)
Woodie
Woodie's Pivot Points are a unique type of Pivot Points made up of multiple key levels and calculated from past price points, in order to frame trades in a simplistic manner.
They vary from the floor pivots in a way they are calculated as they give more weight to the Close price of the previous period.
R1 = 2 x Pivot Point - Low (previous day)
S1 = 2 x Pivot Point - High (previous day)
R2 = Pivot Point + High (previous day) - Low (previous day)
S2 = Pivot Point - High (previous day) + Low (previous day)
R3 = High (previous day) + 2 x [Pivot Point - Low (previous day)]
S3 = Low (previous day) - 2 x [High (previous day) - Pivot Point]
R4 = R3 + High (previous day) - Low (previous day)
S4 = S3 - High (previous day) + Low (previous day)
Camarilla
Camarilla Pivot Points is a versatile pivot point indicator that comprises eight profitable levels which resemble support and resistance values for a current trend. These support points serve as a great indicator and are super popular as they help traders to set the right stop loss and profit target orders.
R1 = Close (previous day) + [High (previous day) - Low (previous day)] x 1.1/12
S1 = Close (previous day) - [High (previous day) - Low (previous day)] x 1.1/12
R2 = Close (previous day) + [High (previous day) - Low (previous day)] x 1.1/6
S2 = Close (previous day) - [High (previous day) - Low (previous day)] x 1.1/6
R3 = Close (previous day) + [(High (previous day) - Low (previous day)] x 1.1/4
S3 = Close (previous day) - [(High (previous day) - Low (previous day)] x 1.1/4
R4 = Close (previous day) + [High (previous day) - Low (previous day)] x 1.1/2
S4 = Close (previous day) - [High (previous day) - Low (previous day)] x 1.1/2
Tom DeMark's
Another popular method of calculating pivot points to forecast the future of the trend is Tom DeMark's Pivot Points, which are not pivot points exactly but are the predicted lows and highs of the period.
If Close > Open: X = 2 x H + L + C
If Close = Open: X = H + L + 2 x C
R1 = X / 2 - L
S1 = X / 2 - H
Fibonacci
Fibonacci Pivot Points work as one of the most popular types of forex indicators used to find support and resistance. It works by calculating the pivot points starting with a base one and using the Fibonacci series of numbers. The most popular levels monitored by the traders are the 38.2% and the 61.8% retracement levels.
Resistance 1 = Pivot Point + ([(High (previous day) - Low (previous day)] x 0.382)
Support 1 = Pivot Point - ([(High (previous day) - Low (previous day)] x 0.382)
Resistance 2 = Pivot Point + ([(High (previous day) - Low (previous day)] x 0.618)
Support 2 = Pivot Point - ([(High (previous day) - Low (previous day)] x 0.618)
Resistance 3 = Pivot Point + ([(High (previous day) - Low (previous day)] x 1.000)
Support 3 = Pivot Point - ([(High (previous day) - Low (previous day)] x 1.000)
Why are Pivot Points important?
Pivot Points are considered to be one of the leading indicators to traders due to their predictive qualities. They serve as an indicator of the overall market trend and help traders determine how prices could potentially turn.
This is extremely important as the price fluctuations are the backbone of Forex and essentially trigger one's buy or sell decision.
There are no rules as to what kind of trader uses the Pivot Point system. In fact, we say pivot points for all as understanding the Pivot Point analysis is undeniably a valuable addition to your trading toolbox.
Use Forex Signals tools for more in-depth analysis

Economic Calendar
Our economic calendar showcases relevant events to help you trade these markets too.

Lot Size Calculator
Calculate the correct lot size for your trade depending on your risk appetite. Enter your entry price and check your risk tolerance.

Profit Calculator
Use our profit calculator to calculate the possible profit from a trade you are considering taking.
Currency Heat Map
Use our free currency heat map to determine the strongest and the weakest currencies on the forex market today.
Pip Calculator
With our free pip calculator you can calculate the pip value in the currency you want to trade in and manage your risk before entering a trade.
Currency Strength Meter
Our free currency strength meter gives you a visual guide to determine the strongest and the weakest currency pairs on the Forex market in real-time.

Monte Carlo Simulator
Simulate your potential returns with our advanced Monte Carlo Simulator developed by internationally-recognised Forex trading coaches.
Support Resistance EA
Download our Support & Resistance EA for MetaTrader 4 (MT4) developed by internationally-recognised Forex experts.

Forex Margin Calculator
The Forex margin calculator can help you calculate the exact margin needed to open and hold your trading position with ease and trade with confidence.
CAGR Calculator
Calculate the Compound Annual Growth Rate of your investments with our easy-to-use CAGR Calculator.
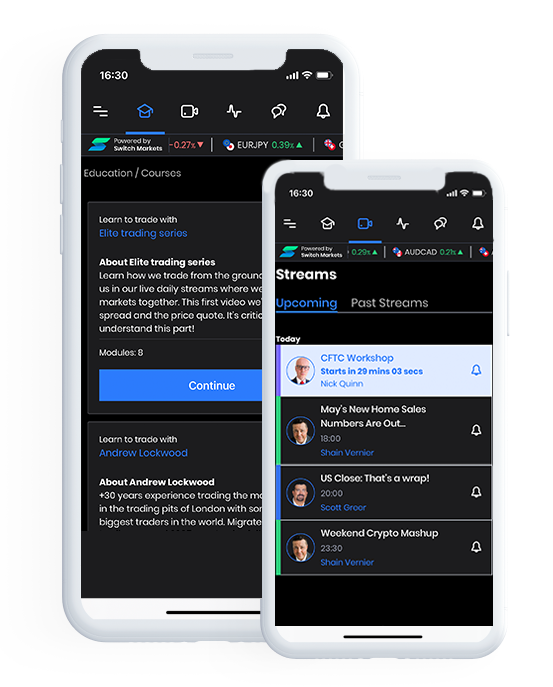
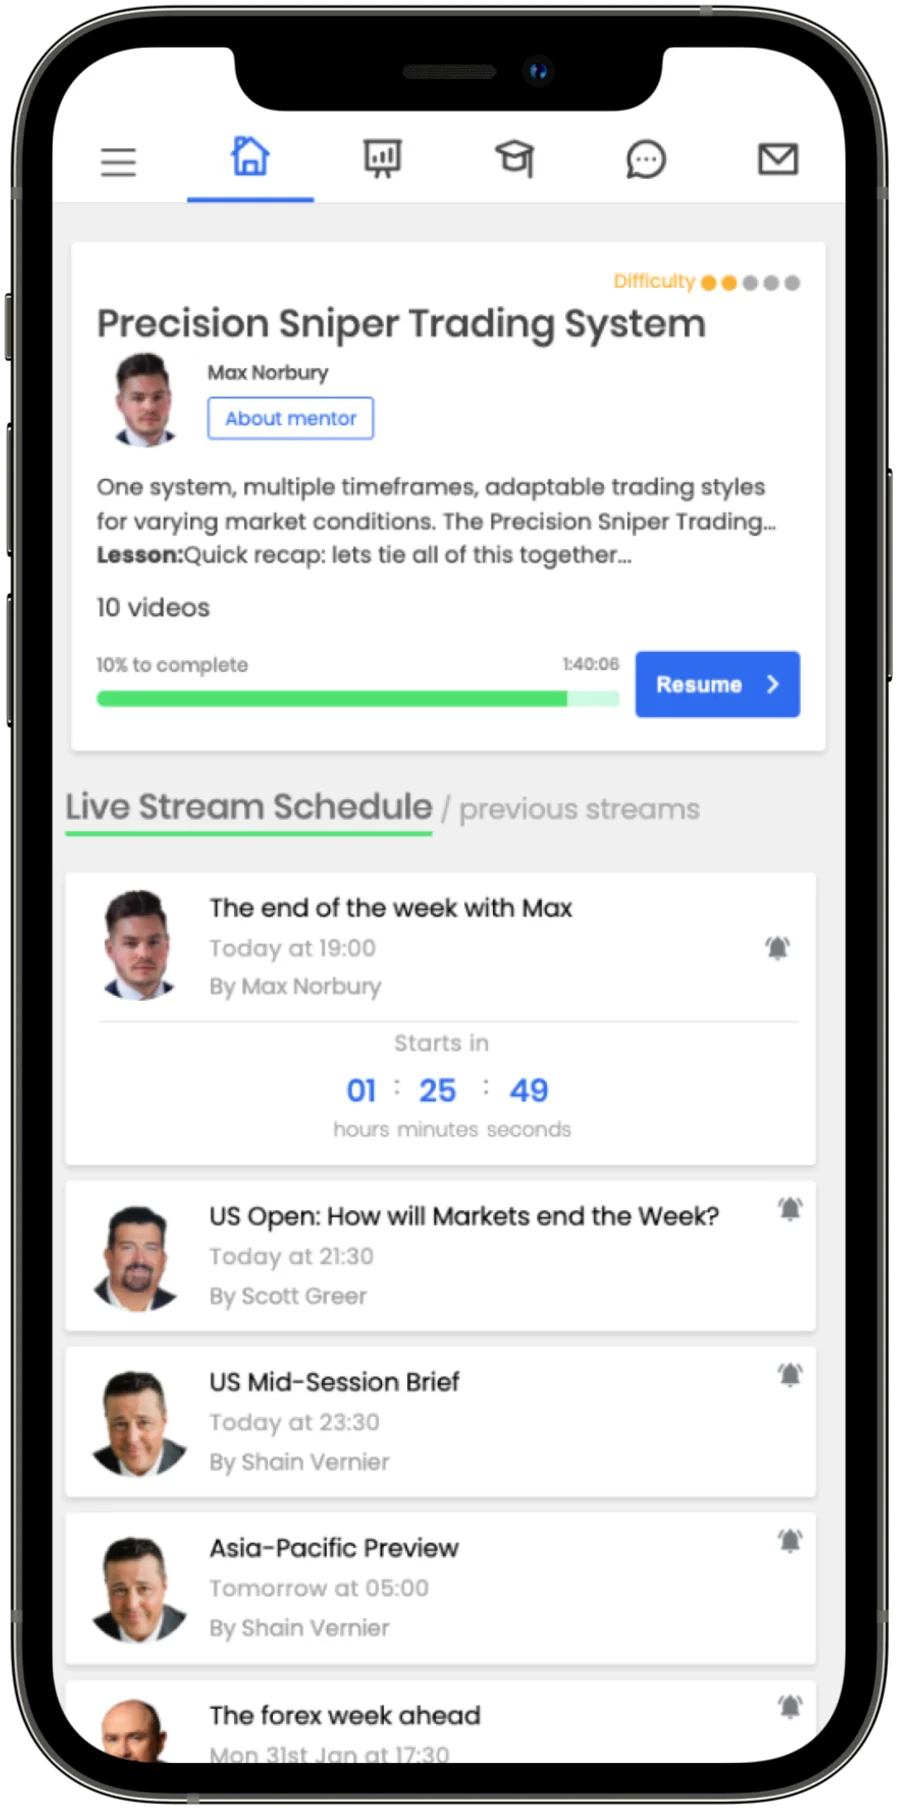
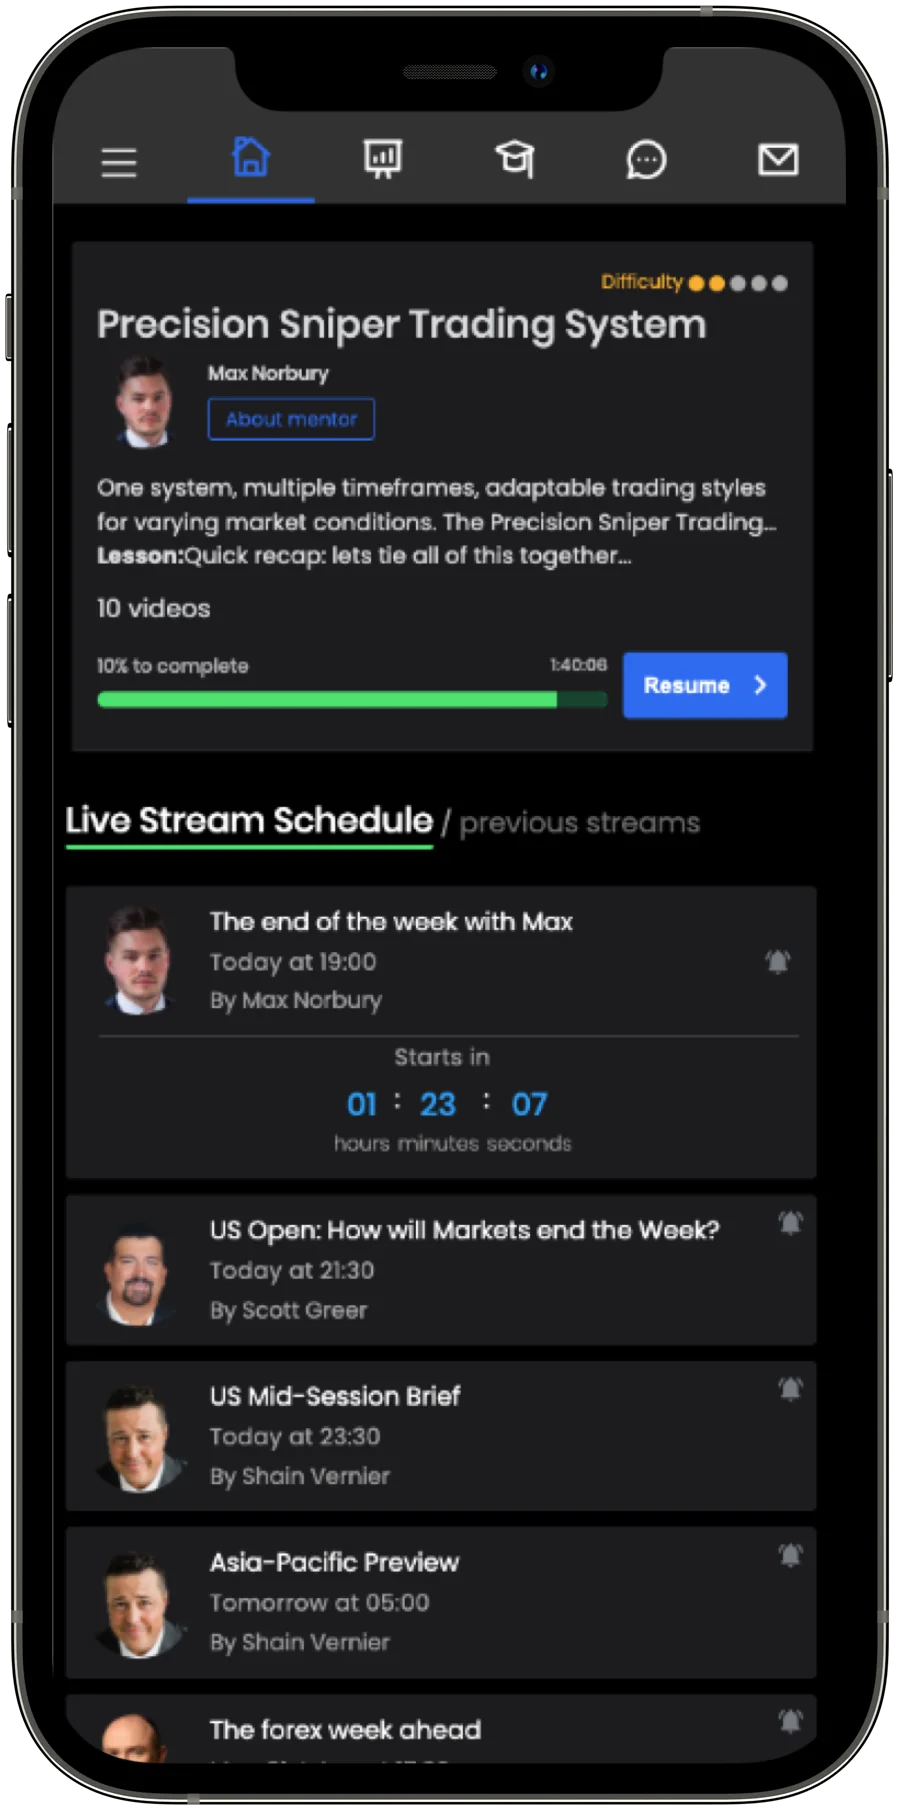
Pivot Point calculator brought to you by the most advanced Trading Room
Join ForexSignals.com and let our educational lessons, daily live streams and community help you understand the financial markets.
Watch demo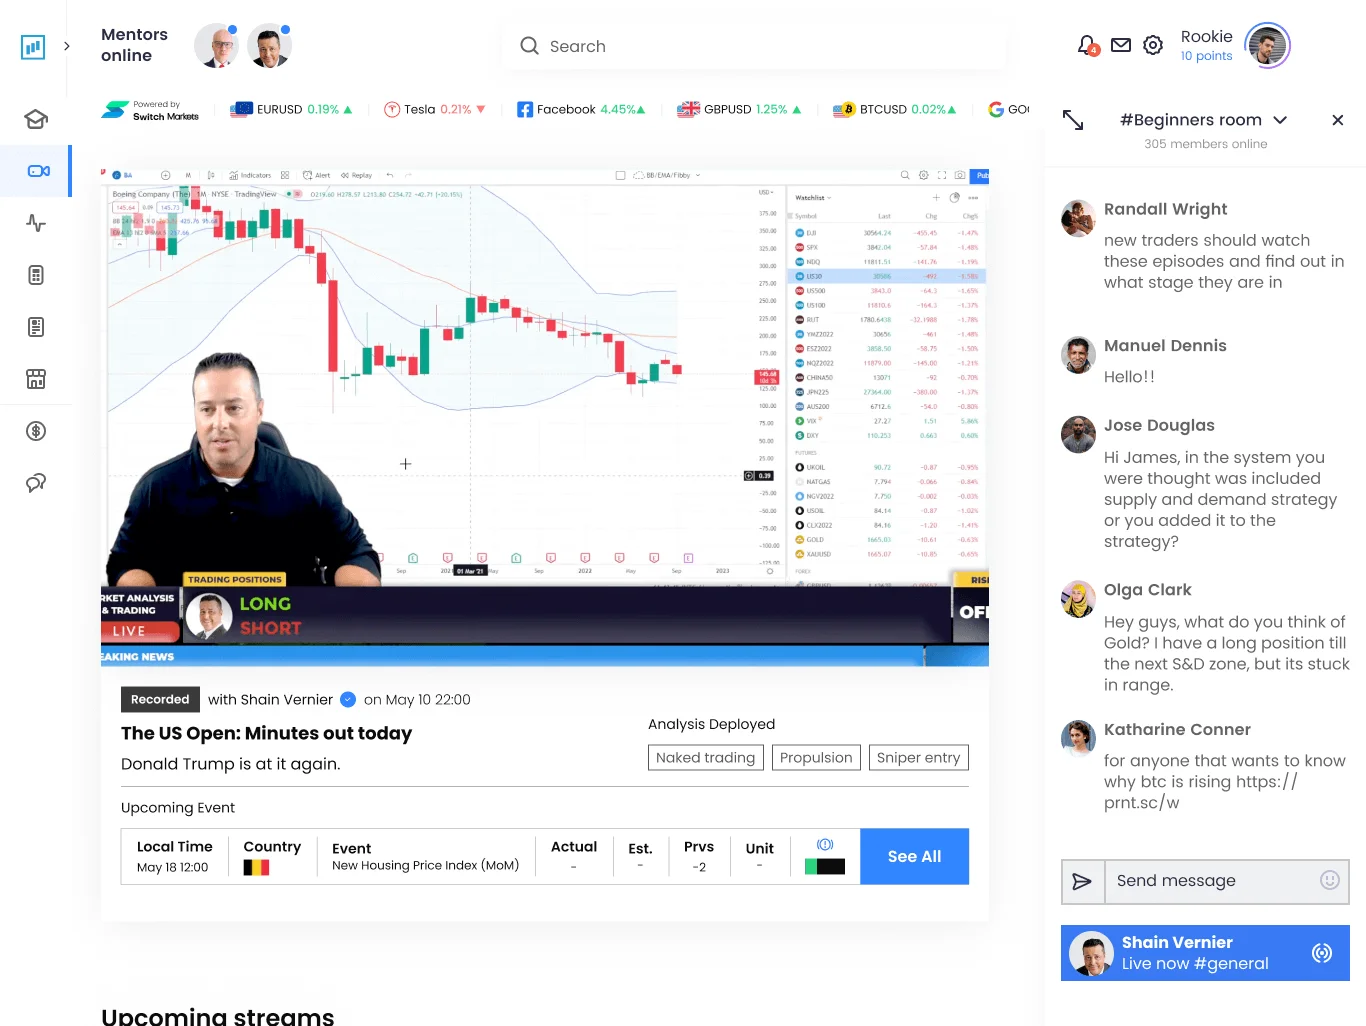
Experienced traders by your side
Our team of trading mentors is there for you. Leverage the 55+ years of their experience and finally crack the markets.
Chat 24/7 with our pro mentorsExperienced in the main financial marketsEvery question will be answered

![Nick]() 5+ years trading experience
5+ years trading experienceNick Quinn
Nick has been trading since 2008. He has experience trading equities, fixed income and commodities. However, his preference is spot market foreign exchange, his style is big picture macro position trading in CFD’s and currency futures contracts.
![forex platforms]() Forex / Equities / Fixed income / Commodities
Forex / Equities / Fixed income / Commodities![forex pie chart]() Technical / fundamental analysis
Technical / fundamental analysis![Shain]() 10+ years trading experience
10+ years trading experienceShain Vernier
Shain is based in the USA and has over 10 years of experience in the markets.
![forex platforms]() Forex / Crypto / Stocks
Forex / Crypto / Stocks![forex pie chart]() Fundamental / Technical
Fundamental / Technical

Trading alone is boring...
Never trade alone again. Join thousands of happy forex traders inside the Trading Room.

Are you ready to take your trading to the next level?
Whether you're starting off with Forex trading basics or you are an
experienced trader, we've got what you need. Start your 7-day
free trial today and find out how we can help you.


 Login To ForexSignals
 Create New Account