Announcement

Collapse
No announcement yet.

RoboForex - Forex Broker: overview and news

Collapse
X
 
  • Filter
  • Time
  • Show
Clear All
new posts

  • Vlad RF
    replied
    How to Trade the "Day Movement" Strategy

    Author : Victor Gryazin


    In this review, we will look at the short-term strategy "Day Movement". It is based on identifying and trading a sideways price range (flat) formed before the start of the European trading session.

    Description of the “Day Movement” strategy

    The "Day Movement" strategy is based solely on technical analysis – it does not use any additional indicators. The main prerequisite for trading this strategy is the presence of a flat. The flat is a sideways price movement without a strict upward or downward direction. Local maximums and minimums of price fluctuations are located at approximately the same level, and quotes move within a limited range.

    According to the rules of this strategy, it is necessary to wait for a sideways range to form on the chart before the start of the European session. The time of formation of the range is from 18:00 server time (GMT+2) on the previous day to 08:00 am on the current day. If the range is formed, two pending buy and sell orders are placed: Buy Stop and Sell Stop, 10 points above and below the limits of this channel, respectively.

    In pending orders, it is possible to set Stop Loss and Take Profit values immediately or do this immediately after opening a position. The Stop Loss level for a pending buy order (Buy Stop) is set just below the bottom line of the price channel. The Stop Loss level for the order to sell (Sell Stop) is established a bit higher than the upper line of the side channel. The Take Profit is set twice as high as the distance to Stop Loss, but no more than 100 points.

    If the price has not reached any of the pending orders by 15:00 (GMT+2), they should be deleted, or the expiry time should be set when the order is initially placed. The strategy applies to currency pairs such as EUR/USD, GBP/USD, and AUD/USD. The recommended time frame is H1. If the market is currently experiencing a strong trending movement, then this strategy should only be used in the direction of the trend.

    How to buy using the “Day Movement” strategy

    The conditions for opening a buy position:
    1. A local sideways range (flat) should form on the H1 chart of the currency pair EUR/USD, GBP/USD, and AUD/USD. The time of its formation is 18:00-08:00 (GMT+2).
    2. A pending Buy Stop order is placed 10 points above the top of the range.
    3. The Stop Loss limit is set beyond the lower limit of the sideways corridor, and the Take Profit is set at twice the Stop Loss value.
    4. If the price has not reached the Buy Stop order by 15:00 (GMT+2), it should be deleted or originally set for expiration at this time.

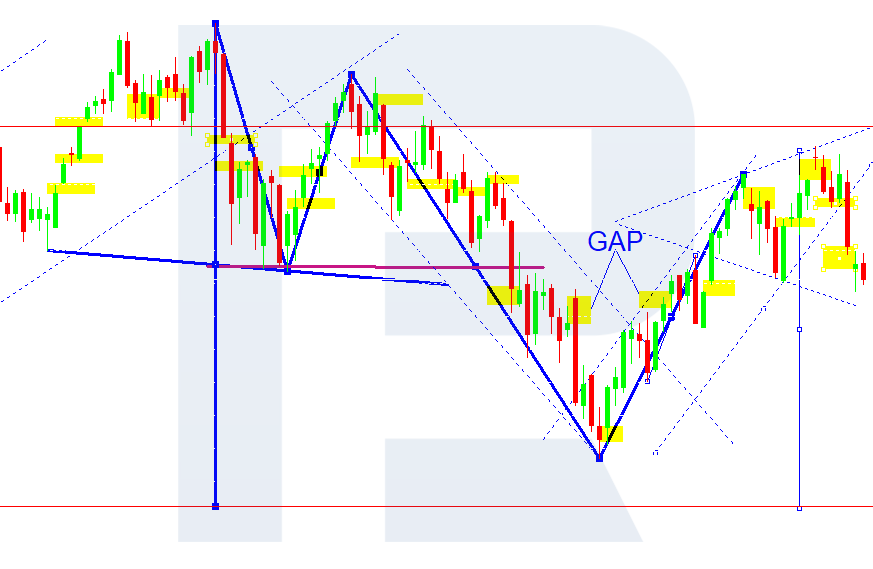
    An example of buying by strategy
    • On the H1 time frame of the currency pair GBP/USD, a sideways price corridor was formed between 18:00-08:00 (GMT+2) within the time frame set by the strategy, with the boundaries of 1.2253-1.2290
    • A pending Buy Stop order is set 10 points above the top of the price range at 1.2300
    • During the European session, quotations rise, breaching the upper limit of the range. A Buy Stop order is activated, and a buy position is opened. Stop Loss is placed beyond the lower limit of the range, and Take Profit is set at twice the Stop Loss.

    https://blog.roboforex.com/wp-content/uploads/2023/01/DayMovement-2-1376x828.png

    How to sell using the “Day Movement” strategy

    The conditions for opening a sell position:
    1. On the H1 chart of the currency pair EUR/USD, GBP/USD, AUD/USD should form a local sideways range (flat). The time of its formation is 18:00-8:00 (GMT+2).
    2. A pending Sell Stop sell order is placed 10 points below the lower limit of the range.

    Read more at R Blog - RoboForex

    Sincerely,
    RoboForex team

    Leave a comment:


  • RF roboforex
    replied
    Dear traders!

    This week, the ContestFX project, as usual, continues with the following competitions:

    The 142nd competition of "Demo Forex" is approaching its end.
    The 398th competition of "Week with CFD" has kicked off today.
    The 532nd competition of "Trade Day" will start on 01.02.2023 at 12:00.
    The 446th competition of "KingSize MT5" will start on 02.02.2023 at 20:00.

    We remind you that all winners of our contests receive prize funds to their real accounts, and they can use them to trade on the Forex market instead of investing their own savings as the initial deposit.

    If you want to be one of the winners, don't miss your chance!

    Sincerely,
    RoboForex Contest

    Leave a comment:


  • Vlad RF
    replied
    How and Why the US Government is Promoting Green Energy

    Author : Eugene Savitsky


    Today we will talk about the government's economic stimulus packages for clean energy in the US. We will look at the American Recovery and Reinvestment Act signed by Barack Obama in 2009, and the Inflation Reduction Act signed by Joe Biden in 2022. Let's analyse the impact of these laws on the development of green energy in the US.

    America’s Recovery and Reinvestment Act

    The US economy was harmed by the financial crisis in 2008. By 2009, unemployment had reached 10.2%, which marked the highest level in 25 years. The US government needed to take urgent measures to jumpstart the economy and create new jobs. In response to the 2008 Great Recession, the American Recovery and Reinvestment Act (ARRA) of 2009 was drafted and passed by the US Congress.

    This act provided for investments of 90 billion USD in clean energy. At that time, this was the largest investment in the energy sector in the history of the United States. This economic stimulus package laid the foundation for dramatic changes in the energy system, such as massive electrification of land transport and an increase in the amount of energy from renewable sources.

    Electrification of the automotive industry

    In 2008, Elon Musk's Space Exploration Technologies Corporation (SpaceX) and Tesla Inc. (NASDAQ: TSLA), which were on the verge of bankruptcy, were rescued by NASA contracts. In 2010, the US Department of Energy granted Tesla Inc. a USD 465 million loan to back it up.

    It can be assumed that the active development and growth of this car company have triggered accelerated electrification of the global car industry. Many manufacturers have supplemented their model ranges with electric and hybrid cars. According to EV-Volumes, the number of environmentally friendly cars on the road has increased from a few hundred thousand to nearly 27 million units over the past ten years.

    https://blog.roboforex.com/wp-content/uploads/2023/01/EV.png

    In 2010, Tesla Inc. was the only publicly traded company in the US that focused exclusively on electric vehicles. The return on investment in this corporation by 2020, before the COVID-19 pandemic-induced crisis, exceeded 5500%.

    Promoting alternative energy sources

    According to the Energy Information Administration (EIA), from 2011 to 2021 inclusive, wind power generation increased by more than 200% to 132,753 MW. Solar power generation increased 88-fold to 93,151 MW. In addition, solar photovoltaic modules, which are capable of producing 1 W of energy, have fallen in price from USD 2.15 to USD 0.27.

    At the time of writing, the largest US solar energy companies by market capitalisation were Enphase Energy Inc (NASDAQ: ENPH), First Solar Inc (NASDAQ: FSLR), and Sunrun Inc (NASDAQ: RUN). They were valued at USD 33.4 billion, USD 18.7 billion, and USD 5.9 billion, respectively.

    With energy-saving technology becoming widespread, the classification of household appliances according to their energy efficiency level has emerged. Fluorescent lamps, which were previously used mainly in industrial plants, were introduced for home use. Moreover, less efficient and more energy-intensive incandescent lamps were gradually replaced by more economical LED lamps.

    [B]Why a law to reduce inflation was passed[B]

    The situation in the US today is very different from what it was after the 2008 crisis: unemployment is at a low level and inflation is in positive territory – there was deflation in 2009. However, the government was now facing a new challenge: the likelihood of continued high inflation.

    This has been facilitated by reduced investment in conventional energy sources, which has led to a reduction in hydrocarbon production and a substantial rise in the cost of hydrocarbons. With hydrocarbons being used to generate electricity and transport products and components, their cost constitutes a significant part of the cost of many products.

    Read more at R Blog - RoboForex

    Sincerely,
    RoboForex team

    Leave a comment:


  • Vlad RF
    replied
    What is OPEC, and How It Influences Crude Oil Prices

    Author : Victor Gryazin

    In this article, we will find out more about OPEC and its activities. We will look at the history of OPEC, and how it was established. We will also try to analyse how the organisation influences world crude oil prices and demand.

    What is OPEC?

    The term OPEC (Organization of the Petroleum Exporting Countries) refers to a group of thirteen of the world's largest oil-exporting countries. The organisation was founded in 1960 to coordinate the petroleum policies of its member countries and the technical and economic cooperation among them. OPEC is headquartered in Vienna, where the executive body, the OPEC Secretariat, manages the day-to-day operations of the organisation.

    OPEC was formed in response to the Seven Sisters alliance, which included major international crude oil corporations such as British Petroleum, Exxon, Mobil, Royal Dutch Shell, Gulf Oil, Texaco, and Chevron. They adversely affected the development of oil-producing countries whose natural resources were actively used.

    According to OPEC's charter, the organisation's mission is to coordinate and unify the oil policies of its member countries and stabilise the crude oil market to ensure an efficient and uninterrupted supply of black gold. The basic principles guiding its work are oil for consumers, stable income for producers, and a fair return on capital for those who invest in the crude oil industry.

    How OPEC affects the price of crude oil

    Cartel members produce about 40% of the world's oil, and their exports account for about 60% of global trade in black gold. OPEC estimates that its member countries accounted for more than 80% of the world's proven oil reserves in 2021.

    https://blog.roboforex.com/wp-content/uploads/2023/01/OPEC-1.png

    Members meet regularly to agree on how much crude oil to collectively sell on world markets. Each member country is assigned its own production quota to which it must adhere.

    In case of sharp price fluctuations, OPEC can regulate quotas and, through them, the world's crude oil supply. If the price of the resource falls, OPEC reduces production – this reduces supply, thereby increasing prices. If the cost of crude oil rises excessively, the cartel can increase production to help bring prices down slightly.

    For example, during the economic crisis of 2020 caused by the COVID-19 pandemic, oil became very cheap: at one point, futures went from $50 per barrel to even below 0. To stabilise prices, the OPEC+ participants decided to substantially reduce the volume of crude oil produced by cutting quotas. The supply level fell, which made prices rise gradually and rebound to the level of $50 per barrel by the end of the year. Eventually, the price of crude oil reached $100/bbl.

    Criticism of OPEC

    OPEC criticism dates back to the 1970s when the organisation was perceived as a monopoly. In 1973, member countries from the Middle East banned crude oil sales to the supporters of Israel in the Arab-Israeli conflict, namely the US, Portugal, the Netherlands, and South Africa. As a result, the price of a barrel of crude oil quadrupled by 1974 and impacted end-users negatively with fuel shortages, and the cost of petrol skyrocketed. The embargo seriously affected the US and other economies.

    In response, Western countries in their attempt to reduce their dependence on OPEC stepped up efforts to produce oil offshore in the Gulf of Mexico and the North Sea. Subsequently, global oversupply and lower demand led to a significant drop in the price of black gold.

    Still, some countries periodically accuse the cartel of collusion, through which they believe it manipulates the price of crude oil by interfering with market pricing.

    The US has drafted a bill, NOPEC (No Oil Producing and Exporting Cartels), which would allow US courts to punish association members and their partners for manipulating production volumes. But the project is still in draft form.

    The future of OPEC

    The world economy needs stability and predictability when it comes to crude oil prices, production, and export volumes. Therefore, OPEC is likely to retain its position as a price regulator in the short term. The cartel's position looks quite stable in the context of the current energy crisis, and the expected growth in demand for black gold in the coming years.

    It is worth noting, however, that in the long term, there are factors that could reduce the impact of the organisation's decisions on the global economy. These could include an increase in the supply of cheap shale oil by non-alliance countries and an increase in the use of renewable energy sources.

    Read more at R Blog - RoboForex

    Sincerely,
    RoboForex team

    Leave a comment:


  • RF roboforex
    replied
    Dear traders!

    This week, the ContestFX project invites you to take part in the following demo competitions:

    The 142nd competition of "Demo Forex" has gained "cruising speed".
    The 397th competition of "Week with CFD" has just started.
    At 12:00, 25th January 2023, starts the 531st competition of "Trade Day".
    At 20:00, 26th January 2023, starts the 445th competition of "KingSize MT5".

    If you haven't participated in our trading contests yet, all you need is to go through a simple registration procedure just once, and then you can get access to all of your favorite contests in just a couple of mouse clicks.

    We wish you all successful trading!

    Sincerely,
    RoboForex Contest

    Leave a comment:


  • Vlad RF
    replied
    What is a Gap? Main Types and Gaps Trading

    Author : Igor Sayadov


    What is a Gap?

    In order to get a full idea of a Gap, let us have a look at the stock market as it features the full range of the peculiarities of this phenomenon. Our example will be the stock index DAX, describing the state of the German economy. It is comprised of the indices of 29 biggest German companies; in a terminal, it is market as DE 30.

    https://blog.roboforex.com/wp-content/uploads/2019/09/1-2.png

    The Gap is shown in the chart above as yellow rectangles. This is a practical gap in the flow of quotations reflecting a serious difference between the opening and closing prices in trading sessions. A quick look at the chart captures a large number of such phenomena. This means that if we classify them we may find a lot of opportunities to use them in trading. But first, let us talk about the reasons which a Gap emerges for.

    Reasons for the Gap emergence

    As a rule, all markets close Friday evening and open Monday morning. During this time, major events may occur in the world: natural and industrial disasters, terrorist acts, as well as elections and speeches of political leaders. All this may make investors reprice the assets abruptly. Thus, pending orders accumulate; upon market opening, they trigger at the opening price without due coverage because of the lack of demand/supply. A weekly Gap, which we can see in the chart, emerges. Of course, such Gaps are featured on daily as well as hourly timeframes, too. Gaps inside a daily session also exist; however, it has no connection to the news, and we shall discuss this phenomenon in subsequent posts about gaps and strategies. And now let us try to classify weekly Gaps.

    Types of the Gap

    Depending on the direction, there are the following types of the Gap:
    • Downward Gap appears when the opening price of a candlestick is much lower than the closing price of the previous candlestick.
    • Upward Gap appears when the opening price of a candlestick is much higher than the closing price of the previous candlestick.
    How to trade Gaps?

    There is a classic, conventional way of trading Gaps. Seven out of ten Gaps are traded on closing. The remaining three are traded on the continuation of the trend. How should a trader tell one type from the other? This is what indicators are used for.

    Firstly, as has been said before, volumes can give a hint, but not an exhaustive one. Secondly, even a simple Moving Average (MA), following the trend, may be of much help.

    Read more at R Blog - RoboForex

    Sincerely,
    RoboForex team

    Leave a comment:


  • Vlad RF
    replied
    How to Start Trading on a Demo Account?

    Author : Andrey Goilov


    Trading is a way of conquering financial markets to make a good profit by applying your skills and knowledge. We can trade from any place on the globe, having neither a boss nor subordinates, which is characteristic of very few jobs. Many beginners rush at trading, having no real experience and thus compromising their money, which, of course, might lead to poor results.

    All beginners are attracted by high percents and wide perspectives often described by experienced traders in their books and blogs. Financial markets do provide such opportunities but you have to take into account your experience and get prepared for systematic trading to make a profit in the long run.

    To gain experience and enhance your future results, you should start with a demo account, where you can test your trading system without risking your real money.

    What is a demo account?

    A demo account is an almost-normal trading account, with real quotations and financial instruments; the trader can open and close their positions following the market. It is identical to a real account in the quotations and the size of positions. The only difference is that the capital is virtual, i.e. the trader does not deposit such an account, only chooses a sum when opening a position, which is later shown in trading.

    https://blog.roboforex.com/wp-content/uploads/2019/10/1-demo-mt4-en-1127x630.png

    Naturally, you cannot spend the profit you make, however, you can feel like you are a real trader, practice your trading methods, and make sure you are psychologically prepared to various market situations.

    How to start trading on a demo?

    After you receive your access data, which are the trader's login and password, you type them in the terminal. For example, if you are using MetaTrader 4 click "File" — "Access account" and introduce your data. After you accessed the account successfully, in the "Trade" section you will see your balance. Now you can start trading.

    To open your first trade, click "New order", choose your financial instrument, choose your direction depending on what is expected (a decline or growth), and click "Sell by Market" if we are forecasting a decline or "Buy by Market" if we are waiting for growth.

    How long do you trade on a demo?

    There are a few opinions on this issue, most of them depending on the timeframe you prefer.

    1. If you trade minutes, it is advised to stick to your demo account for about a month. If you use H4s, you should spend some three to four months on trading. The difference is explained by the fact that on minute charts you receive lots of signals in a small period, such as a week; conversely, trading H4s, you can receive few to no signals at all during the same week.

    2. In most cases, you can have good signals in a flat, but as soon as a trend begins, you lose your funds. However, it may happen vice versa: in a downtrend, the signals are good but in a range or a bullish trend, they are executed poorly. That is why it is so important to sample trading at different stages of the market.

    However, it should be remembered that a demo account will not get you emotionally prepared to trading large real sums. The psychological pressure will be quite strong at the moment of transition to a real account; what is more, to stick to the rules of your system on a real account, you will definitely need some experience with real money.

    Read more at R Blog - RoboForex

    Sincerely,
    RoboForex team

    Leave a comment:


  • RF roboforex
    replied
    Dear traders!

    This week, a RoboForex project called ContestFX will continue with the following exciting competitions:

    The 142nd competition of "Demo Forex" has crossed its "Equator".
    The 396th competition of "Week with CFD" has just started.
    The 530th competition of "Trade Day" will start on 18.01.2023 at 12:00.
    The 444th competition of "KingSize MT5" will start on 19.01.2023 at 20:00.

    Let us remind you that all winners of our contests receive prize funds to their real accounts and they can use them to trade in the Forex market instead of investing their own savings.

    Don't miss your chance to be one of them!

    Sincerely,
    RoboForex Contest

    Leave a comment:


  • Vlad RF
    replied
    RoboForex: upcoming changes to the trading schedule in view of Martin Luther King Jr. Day in the US


    We are informing you that changes will be made to the trading schedule due to the Martin Luther King Jr. Day in the US.

    This schedule is for informational purposes only and may be subject to further change.

    MetaTrader 4 / MetaTrader 5 platforms

    Schedule for trading on CFDs on US indices (US30Cash, US500Cash, and USTECHCash) and CFD on the Japanese index JP225Cash
    • 16 January 2023 – trading stops at 7:45 PM server time.
    • 17 January 2023 – trading as usual.
    Schedule for trading on CFDs on Metals (XAUUSD and XAGUSD) and CFDs on oil (Brent and WTI)
    • 16 January 2023 – trading stops at 7:45 PM server time.
    • 17 January 2023 – trading as usual.
    Schedule for trading on CFDs on US stocks
    • 16 January 2023 – no trading.
    • 17 January 2023 – trading as usual.

    R StocksTrader platform

    Schedule for trading on US stocks and ETFs
    • 16 January 2023 – no trading.
    • 17 January 2023 – trading as usual.
    Schedule for trading on CFDs on US stocks and ETFs
    • 16 January 2023 – no trading.
    • 17 January 2023 – trading as usual.
    Schedule for trading on CFDs on US indices (US500, US30, and NAS100)
    • 16 January 2023 – no trading.
    • 17 January 2023 – trading as usual.
    Schedule for trading on CFDs on Metals (XAUUSD and XAGUSD) and CFDs on oil (WTI.oil, BRENT.oil)
    • 16 January 2023 – no trading.
    • 17 January 2023 – trading as usual.

    cTrader platform

    Schedule for trading on CFDs on Metals (XAUUSD and XAGUSD)
    • 16 January 2023 – trading stops at 7:45 PM server time.
    • 17 January 2023 – trading as usual.
    Please take note of the above trading schedule changes when planning your trading activity.

    Sincerely,
    RoboForex team

    Leave a comment:


  • Vlad RF
    replied
    Gann Concept in Trading: Fundamentals, Algorithm

    Author : Timofey Zuev


    In this article we shall discuss the trading method of William Delbert Gann. While alive, Gann managed to become a legend thanks to his exact market forecasts. First, a bit of his biography. He was born in the family of a poor farmer that cultivated cotton. In early childhood William got to know that the family’s income depended on the prices on “some market”. So, he was eager to know, how and why the prices for cotton change. Later this desire led him to the New York stock exchange, where he opened his broker company 5 years later. However, real success found him when he forecast the capitulation of Germany in the World War I.

    Gann became known for his “sniper” forecasts based on his unique trading method, which later transformed into a whole concept.

    As a great sportsman of present time said, the main thing that is left after a person is their legacy. Well, Gann left a great intellectual baggage after himself. Perhaps, not every trader knows his name, but each and every has at least come across the phrase “Gann’s theory”, not to speak about William Gann’s many followers.

    Gann’s theory: main theses

    The main thesis of Gann’s theory is based on the postulate about the necessity of the balance between the price (quotation) and time.

    Financial markets are very dynamic in essence, which, naturally, makes them attractive for speculators. The level of volatility (variability) of markets can be different. Rate fluctuations on Forex can differ in frequency and amplitude. Meanwhile, Gann’s theory states that in any price change one may see certain patterns. In other words, though chaotic at he first sight, fluctuations of quotations presuppose a certain degree of order in their structure. The ability of a speculator to identify this data timely guarantees that their forecasts will have a real basement and come true in the end. As the author of the theory said: “Future is a repetition of the past”. Which means that all actions on the market are cyclic and can be forecast.

    An argumentative forecast of the market dynamics is an indisputably important factor of success of any speculative trade.

    Gann’s theory states that a very important moment of the market analysis is to define the so-called balance points correctly. These points of balance between the price and time let the player forecast future rates and detect the priority vector of further market dynamics.

    Gann developed a lot of instruments meant to help the analyst (trader) define the aforementioned points:
    • using patterns, formed by market fluctuation patterns;
    • using “angles” and “squares” of time and price (quotations);
    • studying the factors of time.
    Apart from this, on the basis of William Gann’s drafts, several indicators have been developed; they lay the foundation of the market analysis according to Gann’s method. By the way, Gann Grid is integrated into each MT4 and MT5 terminal, which proves the genius of Gann and his theory (Insert-Gann):

    https://blog.roboforex.com/wp-content/uploads/2020/01/gann-977x630.png

    According to the basic theses of Gann’s theory, financial market can be interesting for speculations in two typical cases only:
    • when time goes ahead of the price on the chart;
    • when the price goes ahead of time on the chart.
    If the market remains in perfect balance for a long time, it is of no particular interest for trading as no significant movements are to be expected.

    The essence of Gann’s theory

    On the whole, Gann’s theory is based on drafting certain geometrical patterns and angles. When analyzing the market according to Gann, the main attention is paid to the interrelation of time, price and the patterns. Thus, for successful market forecasts one should know how to use squares, circles, angles, lines etc. What is more, each figure is to be used at the right moment and in the right order.

    All the aforementioned reveal the main drawback of the theory – it does not suit inexperienced traders. Some traders use the main principles of the theory and certain indicators separately, which is wrong in the essence. For successful use of Gann’s theory all its components should be applied in complex, because they supplement each other, and the trader should perform the whole series of actions when analyzing market movements.

    Read more at R Blog - RoboForex

    Sincerely,
    RoboForex team

    Leave a comment:


  • RF roboforex
    replied
    Dear traders!

    This week, the ContestFX project is waiting for everyone in the following competitions:

    The 142nd competition of "Demo Forex" is gaining momentum.
    The 395th competition of "Week with CFD" has just kicked off.
    The 529th competition of "Trade Day" will start on 11.01.2023 at 12:00.
    The 443rd competition of "KingSize MT5" will start on 12.01.2023 at 20:00.

    Joining the list of our contestants is easy - all you need to do is to go through a simple registration procedure, and all of the competitions you may want to take part in will become available in just a couple of mouse clicks.

    We wish you success!

    Sincerely,
    RoboForex Contest
    ​​

    Leave a comment:


  • Vlad RF
    replied
    11 Rules of Effective Capital Management On Forex

    Author : Timofey Zuev

    There is no successful Forex player that has achieved a good and stable result without an efficient money management system. Wise and weighted up capital management allows for playing on the high-risk market thanks to marginal trading. In this article we are going to have a look a the main rules and principles of money management on Forex.

    Rule № 1

    The size of the margin must not exceed 10-15% of the deposit.

    https://blog.roboforex.com/wp-content/uploads/2019/10/shutterstock_608737850.jpg

    This rule helps calculate the margin for the orders to open. The remaining sum is necessary for normal work of the trader and for avoiding force majeure on the market: Forex may behave unexpectedly.

    As for the suggested margin, its maximum size is not always the same. For example, Murphy suggested that it should not exceed 50%; however, other sources advise to stick to the margin amounting to 5 to 30% of the deposit. Anyway, the approach should go in line with the initial size of the deposit, as long as the smaller it is, the harder it is to go along the conservative way.

    Rule № 2

    The investment into one instrument or a group of assets with high correlation coefficient must not exceed 15% of the deposit.

    This helps diversify risks and avoid strong dependence on the result of the trade.

    On Forex there are groups of instruments as yen pairs, groups of allied currencies like EUR/USD и GBP/USD, AUD/USD и NZD/USD, metals like XAU and XAG and so on. Currency pairs of one group normally move in the same direction, slightly lagging behind one another. Thus, large investments into one instrument or the assets of one group go against the rules of risk control. The principles of efficient funds use are also to be kept in mind. Money should be allocated in such a way that a trade resulting in a large loss does not rid the trader of the whole deposit.

    Rule № 3

    Each instrument must imply a risk no bigger than 5% of the deposit.

    https://blog.roboforex.com/wp-content/uploads/2019/10/shutterstock_1411852109.jpg

    This rule seems rather arguable, and its feasibility to a big part depends on the size of the trading capital. The risk of the trade may vary from several tenths of a percent to 10-20%. It does not relate to traders who do not regulate risks at all, the only limit being the size of their deposit.

    If we turn to classics, Elder suggested 1.2-2.0% risk for one trade, Murphy – 5.0%.

    Rule № 4

    Define the level of diversification of instruments.

    Regardless of diversification being one of the most efficient ways of protecting money, one should not overuse it. There should be a certain balance between concentration and diversification of assets. Excess diversity of the instruments used in trading makes the trader lose their concentration which may lead to untimely reaction to the market movements and a decrease of productivity.

    Allocation of assets to 5-6 different instruments of various groups is considered most efficient. The bigger the coefficient of inverse correlation is, the higher is the diversification level.

    Rule № 5

    Put Stop Loss orders.

    The main purpose of Stop Loss order is to limit the trader’s losses. Some put them every time opening a trade, others do so only for the time of their absence from their workplace. However, it is always worth remembering that Forex is an unpredictable market, and the movements of currency pairs can be sharp and quick. As a consequence, traders may suffer excessive losses, because they may not react in time, even sitting in front of the computer screen.

    The size of a Stop Loss depends on two factors: the size of the loss that the trader is ready to suffer and the situation on the market.

    Let me give you an example. The trader’s deposit is 1,000 USD. The risk of a trade is 5%. The volume of the trade is 0.02 lot. In such circumstances they can afford a loss of 50 USD, and in case the price is 0.1 USD per 0.01 lot for a pair, as, say, with GBPUSD, the Stop Loss should be no farther than 250 points from the entrance to the position.

    Read more at R Blog - RoboForex

    Sincerely,
    RoboForex team

    Leave a comment:


  • Vlad RF
    replied
    Harmonic Patterns in Trading

    Author : Victor Gryazin


    In this article, we will consider the use of harmonic patterns in trading. We will get acquainted with the history of their emergence, and the principles of their formation, and tell you about the most popular patterns.

    What are harmonic patterns?

    Harmonic patterns are graphical price patterns based on a combination of Fibonacci ratios and Elliott wave elements. The basis for such patterns was laid down in the works of Harold Gartley, a renowned analyst, and technical analysis specialist. His book "Profits in the Stock Market" describes his trading methodology in detail.

    The harmonic patterns became widely known and popular at the end of the last century when Gartley's works were further developed by his followers – Scott Carney, Larry Pesavento, and Bryce Gilmore. They have refined the description of already known models, and also identified and described new ones.

    Harmonic patterns are versatile: they can be used to trade on different timeframes and financial markets. The most popular are Gartley, Butterfly, 5-0, Crab, ABCD, Bat, and Shark.

    Gartley pattern

    The Gartley pattern is one of the first harmonic patterns described. It is also called "Gartley's butterfly" because of the similarity in the outlines of price movements, and the Fibonacci lines on the chart resembling the wings of a butterfly.

    Stages in the formation of the Gartley pattern:
    • XA is the first impulse of the price movement on the chart
    • AB is the correction from the first XA movement at approximately 61.8%
    • BC can be 38.2%, 50%, 61.8%, 78.6%, 88.6% of the AB wavelength
    • CD can be 127.2%, 146%, 150%, and 161.8% of the BC wavelength and ends around the correction level of 78.6% of the XA wavelength
    • The D-point is the final point in the pattern, where a reversal of quotes is expected

    https://blog.roboforex.com/wp-content/uploads/2022/12/Harmonic-1-768x398.jpg

    Butterfly pattern

    The Butterfly pattern, created by Bruce Gilmore, is very similar to the one mentioned above. Therefore, understandably, many traders confuse the two.

    Stages in the formation of the Butterfly pattern
    • XA is the first impulse of the price movement on the chart
    • AB is the correction from the first XA movement at approximately 78.6%
    • BC can range from 38.2% to 88.6% of the AB wavelength
    • CD can range from 161.8% to 224% of the BC wavelength and ends at about 127.2% of the XA wavelength
    • The D-point is the final point in the pattern, where a reversal of quotes is expected

    https://blog.roboforex.com/wp-content/uploads/2022/12/Harmonic-2.png
    5-0 Pattern

    The 5-0 pattern was first described in detail in Scott Carney's book "Harmonic Trading: Volume Two", which was published in 2007. Visually, it resembles the Head & Shoulders and Wolf Waves patterns.

    Read more at R Blog - RoboForex

    Sincerely,
    RoboForex team

    Leave a comment:


  • RF roboforex
    replied
    Dear traders!

    The RoboForex Company project called ContestFX congratulates you on the coming year 2023 and wishes health and prosperity to you and your loved ones! This new year, our demo contests will start on January 2, and you will be able to take part in them, as usual, completely free:

    The 142nd competition of "Demo Forex" and the 394th competition of "Week with CFD" both will start on 02.01.2023.
    The 528th competition of "Trade Day" will start on 04.01.2023 at 12:00.
    The 442nd competition of "KingSize MT5" will start on 05.01.2023 at 20:00.

    The winners of our contests will receive their prize money deposited to their real trading accounts.

    We wish you good luck throughout the 2023 year!

    Sincerely,
    RoboForex Contest

    Leave a comment:


  • Vlad RF
    replied
    What is Scalping on Forex?

    Author : Dmitriy Gurkovskiy


    Who in the world of trading hasn’t heard of scalping? Probably, you may know it as pipsing, but all traders surely heard a lot of different things about it, some of them tried it in practice, others are just going to, that’s why I guess it would be interesting to go into details of such thing as scalping.

    Scalping definition

    Let’s start with the definition. Scalping is a type of a trading strategy for trading on currency, stock and commodity markets. The distinctive feature of scalping is closing an order when the profit reaches several pips. This definition is offered by a lot of public trading-related web resources. In addition to that, some of they say that a scalping position is held from several second to several minutes. Under this approach to scalping, it may be regarded as an element of a high frequency trading.

    We can go deep in the theme and “lift the curtain” over scalping, which is considered by many traders as almost perfect and advanced method of trading.

    The question above helps expand the concept of scalping as it is, because the period of holding an order is too small, the profit may be almost equal to spread expenses, and the risk level for a position may by far exceed the potential benefit. In today’s technology intensive world, computers are vastly superior to enthusiasts of manual trading, but this competition allowed traders to expand the border of scalping as a trading instrument.

    https://blog.roboforex.com/wp-content/uploads/2019/10/pips-trading.jpg

    One should realize that there is a difference between scalping on the Forex and stock markets. In case of the former, traders use additional tools, such as Time & Sales and Depth of Market. Some Forex brokers make concessions and reduce commissions for scalpers. However, efficiency of scalping on stock markets even with additional helpers is rather questionable. The key thing in trading is the market liquidity, while scalping can be used even during periods of low volatility and liquidity.

    Scalping strategies

    Most scalping strategies are based on breakouts of support and resistance areas, for selling and buying respectively. Additional tools that are used by traders for determining support/resistance levels are line charts embedded in trading platforms (MT4, MT5, R WebTrader, etc), as well as fractal indicators, Parabolic SAR, and almost full range of Envelope-type indicators, which form mobile support/resistance levels taking into account volatility and averaged price movements per specified numbers of candlesticks.

    The figure shows an example of scalping strategy using the VoltyChannel_Stop indicator. The logic of this system is based on a breakout of the indicator’s endpoint as a signal to open an order. The price movement range after the control level had been broken was from 4 to 34 pips, which is quite enough for a scalper. The only thing that may raise questions is where exactly every scalper intends to close their order.

    In other words, possible profitability can be calculated in some specific range. We should also note that scalpers use quite large parts of their deposits in trading, from 10% to 50%. Depending on the opening/closing strategy, a scalper opens from 5 to 50 orders in case of constantly being in front of a computer and trading very actively. Consequently, we can calculate that scalper’s daily profitability may vary from 2% to 100%, but it requires a lot of work without any breaks.

    Read more at R Blog - RoboForex

    Sincerely,
    RoboForex team

    Leave a comment:

Working...
X