Announcement

Collapse
No announcement yet.

RoboForex - Forex Broker: overview and news

Collapse
X
 
  • Filter
  • Time
  • Show
Clear All
new posts

  • How to Create an Investment Portfolio on Forex?

    Author : Anna Rostova

    How to become an investor? Where to start and what is an investment portfolio? Let’s try to see into the matter and find out what exactly a person, who decided to start investing, should do.

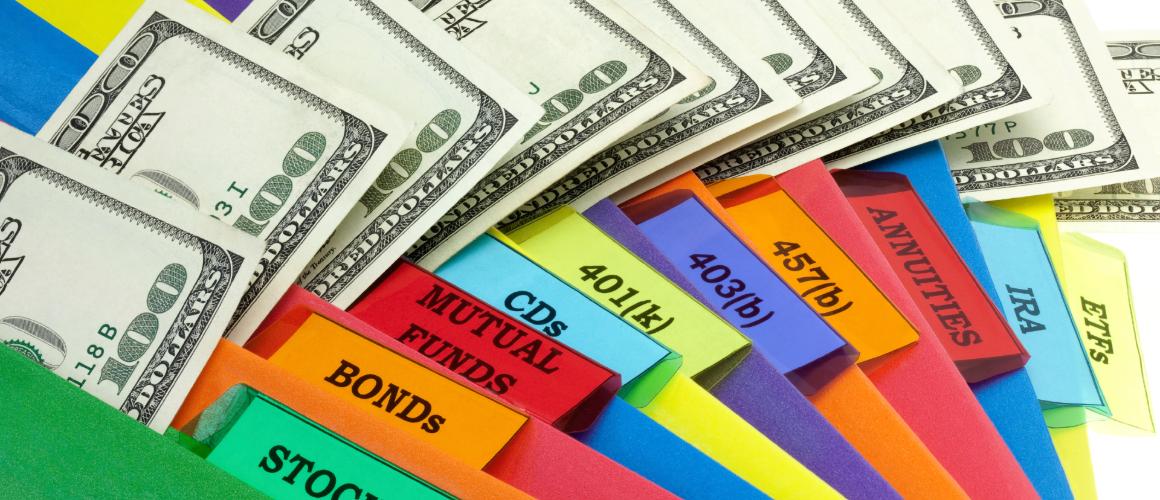
    An investment portfolio is a set of financial instruments. The purpose of acquiring such instruments is of course making profit in the future. Options, stocks, futures, metals, real estate, currencies, and many other assets – all of them can be considered as financial instruments.

    The purpose of any investor is getting maximum profit while incurring minimum risks. Unfortunately, it doesn’t always happen this way. In order to balance possible profit and losses, investors diversify their assets, which means that they don’t invest all their money in one particular instrument, and allocate their funds into several different items.

    Investment portfolio on Forex

    For example, we’ve decided to create an investment portfolio using the instruments traded on the forex market (it’s possible and happens quite often). What we do in this case is the following: decide on the invested sum and the profit we’d like to receive, and then explore, explore, and once again explore all available options.

    Let’s get into more details. First of all, we must decide on the amount of funds we’d like to invest in this project and the amount of profit we’d like to receive. It makes sense to set minimum thresholds and not try to get all at once. There are several types of investment portfolios, with the most popular being conservative and aggressive. The first one implies getting a small positive result with minimum (if possible) risks. One shouldn’t expect this investment portfolio type to yield extra high profit – your profit will increase slowly. The second type is an aggressive investing, which may earn you a lot of money, but risks and possible losses in this case are much higher as well.

    When investing in instruments of the currency market, investors supposedly create an aggressive type of portfolio. It happens because most of currencies and metals are highly volatile, in other words, their prices are very mobile and this fact can be successfully used to get investment revenue.

    Creating a portfolio

    Now let’s try to figuratively group several instruments for our portfolio. Of course, it will be approximate, because all investors have their own preferences. First off, we should start with those currency pairs, which are trading at lows: they are more likely to grow than those trading close to highs. When it comes to investments, it might be better to buy than sell.

    After that, one should take the correlation into account, which is the way how currency pair movements depend on each other. From this point of view, it might be dangerous and unwise to buy two instruments that are trading in almost the same direction, because if they start falling, your losses may be doubled. On the other hand, buying two instruments that are moving in different directions might be rather dangerous and risky as well. For instance, in most cases EUR/USD and GBP/USD are moving in the same direction, so if we buy them in the same volume, both pairs will simultaneously be either profitable or loss-making. In this light, opening positions in these instruments in different directions is not a good idea, as the profit received from one of the pairs will only compensate losses incurred from the other one.

    Long-term investments

    So, what should we do then? The most viable option will be creating a long-term investment portfolio with currency pairs or metals, which are not correlated to each other. For this purpose, one may use cross rates as well, despite their spreads being quite wide. However, it won’t matter much for long-term or mid-term investments.

    After your investment portfolio is created, it’s necessary to decide how to allocate your invested money, in percentage terms. For instance, you may equally divide your money into all instruments or invest more funds in some particular ones. In each case, investors make their own decisions, because there is no any universal schemes for this.

    Read more at R Blog - RoboForex

    Sincerely,
    RoboForex team

    Comment


    • Dear traders!

      This week, the ContestFX project will continue with the following exciting competitions on demo accounts:

      The 141st competition of "Demo Forex" is gaining momentum.
      The 391st competition of "Week with CFD" has just kicked off.
      The 525th competition of "Trade Day" will start on 14.12.2022 at 12:00.
      The 439th competition of "KingSize MT5" will start on 15.12.2022 at 20:00.

      We remind you that upon winning any of our competitions, all winners receive prize funds on their real accounts that can be used for trading in the Forex market instead of the winners' own money.

      We wish you all successful trading!

      Sincerely,
      RoboForex Contest

      Comment


      • How to Trade the Crab Pattern

        Author : Victor Gryazin

        In this review we will get acquainted with the harmonic Crab pattern. We will consider the stages of its formation on the price chart, and the strategy for its use in trading. We will compare it with the Deep Sea Crab pattern.

        What is the Crab pattern?

        This harmonic pattern was introduced to the trading community by Scott Carney in 2000. Its structure is very similar to many popular harmonic patterns, including the famous "Gartley’s Butterfly". The difference is in the different Fibonacci ratios: in the hero of our material, the final segment has a longer extension.

        The harmonic Crab pattern consists of five points (X, A, B, C and D) and four price swings (XA, AB, BC and CD). The last one is formed by the point D, which is a potential reversal area. Its appearance is considered as a signal to open the positions for buying or selling. The appearance of the pattern on the chart signals the end of the current price impulse and the forthcoming reversal.

        Stages of formation
        • XA is the first impulse of the price movement on the chart.
        • AB is the correction from the first XA movement, ranging from 38.2% to 61.8%.
        • BC - can range from 38.2% to 88.6% of the length of AB.
        • CD, the longest wave, ends around the 161.8% retracement level of XA and is an extension of 224-361.8% of VS.
        • Point D is the final stage of formation.
        A pattern can form on different timeframes. It can often represent a correction area, after the end of which the preceding trend is likely to continue. Relevant for trading in forex, stock, commodities and other financial markets.

        https://blog.roboforex.com/wp-content/uploads/2022/12/Crab-1.png

        How a bullish Crab pattern is formed
        • The first impulse of the XA price movement is upward.
        • On the AB section, the price reverses and declines by 38.2-61.8% from XA.
        • On the BC section, the price reverses again and rises to 38.2-88.6% of AB.
        • On the CD, the price is actively declining and reaches about 161.8% of the XA. This is the longest wave.
        • After the formation of the D-point, an upwards reversal and a further rise is expected.
        How to trade the bullish Crab pattern
        • A buy position can be opened once the D-point has been formed and quotes have shown an upward reversal.
        • The Stop Loss is placed just below the pattern low at point D.
        • The points X, B, C and the maximum of the model at point A can be used for Take Profit.
        Read more at R Blog - RoboForex

        Sincerely,
        RoboForex team

        Comment


        • Trading on Forex – A Primary Source of Income

          Author: Dmitriy Gurkovskiy


          There are a lot of discussions about trading within the boundlessness of the Internet, both in conventional businesses and state-financed organizations. People say and write a lot of different things. More often than not, they are sure that trading can’t be regarded as a primary source of income. Arguments in these judgment call are as follows: “No matter how professional, cold-blooded, or wise you are, all these personal qualities won’t help you if markets don’t give you a chance to earn money, because markets offer such chances only at some particular periods of time. And if you trade every day, you are doomed to failure.”

          Forex stereotypes

          Many people have similar views on the matter and say that trading may be considered only as some kind of a part-time activity in addition to one’s main day job, occupation or business, because like we’ve said before, markets offer chances to earn money only at some particular short periods of time, while the rest of the time is simply wasted. According to these discussions, to avoid wasting time one should think of trading as a secondary activity (income, earnings) or get a job at brokers, investments/asset management, etc. Independent, so called home-made, traders and investors are foretold only falling into a decline or losing all their money and going broke.

          Of course, you can agree or disagree with this opinion, it’s your private stance. However, no one prohibits you to think of about a possibility of turning your personal trading activities on global financial market into something more than just a leisure, an opportunity to earn 100 extra bucks into a real business or a job that earns you considerable money. That’s why, I suggest you to decide on your approach to trading, its daily schedule, and the level of income you want to get from it to cover all your subsistence needs, because these are the criteria that you usually follow when starting your own business or applying for a job.

          And of course, you have to make up your mind about an average weekly/monthly income. Probably, the income level issue may be the most essential for many of people, but it shouldn’t become a “stumbling block”, because trading is a complex matter, not a complexing one. Also, this issue may bring down to earth some beginners, who want to start trading with 100 USD and expecting to see 1,000 USD on their account balance at the end of the month. Yes, the reality is that stability and longevity on the market are controlled by modesty and common sense.

          Trading system

          Well, first things come first. If you plan a steady monthly income of 1,000-2,000 USD, you must have 10,000-20,000 USD on your account balance on the first day of trading. Of course, this level of income is possible if you trade very carefully and in a risk averse way. If you’re more advanced in risk management, you can start trading with 5,000 USD and hope for 1,000-1,500 USD a month. In other words, this is a basis for “home/couch” trading. Still, you must always remember that your entire work should be based directly on your trading system! It means that your trading system should adapt to all periods of market activity and earn 40-50 pips every day. Given this, we can assume that a daytrader’s standard trading volume is 0.2-0.4 lots.

          Yes, it can! Your task reduces to find and track a trading instrument that can match this speed and distance and then just copy successful trades/deals. At the same time, you should realize that not all deals will be profitable, that’s why think of increasing profitable periods to cover losses suffered during drawdowns. If you survive this rhythm/schedule for at least 6 months, you can count on a glittering future and start your career as an asset management company in CopyFX and RAMM. You can create trader communities to attract investors and manage big money. This scaling, if not to say socializing, method, will help you to avoid risks of asocial burnout due to lack of social communication, which is a very common thing for retail traders and investors.

          Conclusion

          To put it shortly, one can draw the following conclusion: it is possible to turn trading into a primary source of income if you create your own strategy and abide by its rules. However, if you don’t have what it takes yet, I mean strategy, knowledge, skills, money, don’t rush to quit your job. Just continue practicing, accumulate experience and money.

          Read more at R Blog - RoboForex

          Sincerely,
          RoboForex team

          Comment


          • Dear traders!

            This week, the ContestFX project invites everyone to take part in the following competitions:

            The 141st competition of "Demo Forex" has crossed its "Equator".
            The 392nd competition of "Week with CFD" has just started.
            The 526th competition of "Trade Day" will start on 21.12.2022 at 12:00.
            The 440th competition of "KingSize MT5" will start on 22.12.2022 at 20:00.

            It is very easy to take part in our demo competitions and receive prize money if fortune smiles upon you - for this all you need is to go through a simple registration procedure, and then all the contests will become available to you in just a couple of mouse clicks.

            Join us!

            Sincerely,
            RoboForex Contest

            Comment


            • RoboForex: changes to the trading schedule in view of the Christmas and New Year holidays

              We are informing you that there will be some changes to the trading schedule during the Christmas and New Year holidays.

              This schedule is for informational purposes only and may be subject to further change.

              MetaTrader 4 / MetaTrader 5 platforms

              Schedule for trading on DE40Cash
              • 26 December 2022 – no trading
              • 27 December 2022 – trading as usual
              Schedule for trading CFDs on US stocks
              • 26 December 2022 – no trading
              • 27 December 2022 – trading as usual
              • 2 January 2023 – no trading
              • 3 January 2023 – trading as usual
              Schedule for trading on other instruments
              • 26 December 2022 – trading starts at 10:00 AM, server time
              • 27 December 2022 – trading as usual
              • 1 January 2023 – no trading
              • 2 January 2023 – trading as usual (cryptocurrencies)
              • 3 January 2023 – trading as usual (all instruments)

              R StocksTrader platform

              Schedule for trading on GER40
              • 26 December 2022 – no trading
              • 27 December 2022 – trading as usual
              Schedule for trading on CFDs on UK stocks and UK100 index
              • 24 December 2022 – trading stops at 2:30 PM, server time
              • 26 December 2022 – no trading
              • 27 December 2022 – no trading
              • 28 December 2022 – trading as usual
              • 30 December 2022 – trading stops at 2:30 PM, server time
              • 2 January 2023 – no trading
              • 3 January 2023 – trading as usual
              Schedule for trading on CFDs on German stocks
              • 26 December 2022 – no trading
              • 27 December 2022 – trading as usual
              • 30 December 2022 – trading stops at 3:00 PM, server time
              • 31 December 2022 – trading as usual
              • 2 January 2023 – no trading
              • 3 January 2023 – trading as usual
              Schedule for trading on CFDs on Austrian stocks
              • 26 December 2022 – no trading
              • 27 December 2022 – trading stops at 3:15 PM, server time
              • 28 December 2022 – trading as usual
              • 2 January 2023 – no trading
              • 3 January 2023 – trading as usual
              Schedule for trading on CFDs on EU stocks
              • 26 December 2022 – no trading
              • 27 December 2022 – trading as usual
              • 2 January 2023 – no trading
              • 3 January 2023 – trading as usual
              Schedule for trading on other instruments (including CFDs on cryptocurrencies)
              • 26 December 2022 – trading starts at 10:00 AM, server time
              • 27 December 2022 – trading as usual
              • 1 January 2023 – no trading
              • 2 January 2023 – trading as usual (cryptocurrencies)
              • 3 January 2023 – trading as usual (all instruments)

              cTrader platform

              Schedule for trading on all instruments
              • 26 December 2022 – trading starts at 10:00 AM, server time
              • 27 December 2022 – trading as usual
              • 1 January 2023 – no trading
              • 2 January 2023 – no trading
              • 3 January 2023 – trading as usual

              Please take note of the above trading schedule changes when planning your trading activity.

              Sincerely,
              RoboForex team

              Comment


              • What is the Cost-of-Living Index?

                Author : Victor Gryazin


                In this article, we will look at the Cost-of-living index (COLI), and find out what it is useful for. We will look at what items of expenditure it takes into account, how it is calculated, and how it differs from the Consumer price index (CPI).

                What is the cost-of-living index?

                The Cost-of-living index (COLI) is a price index that captures changes in the relative cost of living over time and across regions. It characterises changes in the prices of consumer goods and services in relation to a fixed set of goods and services that make up the basket of goods and services for certain categories of the population.

                COLI is an estimate of how much money a person needs to live in a certain place. It is therefore a widely used indicator to compare living standards in different regions.

                The index is not an official government statistic but is calculated by various private companies around the world. This indicator can help a person determine whether the income or wages they receive are sufficient to cover basic expenses where they want to live and work.

                How the cost-of-living index is calculated

                There are many different methodologies that have been developed to calculate the cost of living index. The general formula compares the costs to the consumer of one year's prices with the equivalent costs of another year's prices. In a simplified format, it looks like this:

                P = C(u,p1) / C(u,p0)
                • P is the cost-of-living index
                • C(u,p1) is the cost to the consumer for a given set of prices p1
                • C(u,p0) is the cost to the consumer for a given set of prices p0
                Many COLI calculations use a "base" cost of living, which is usually taken as 100. This base can be the cost of living in Chicago, for example, or an average of several regions. Other regions are measured in relation to the baseline. If it is 20% more expensive on average to live in New York than in the "base" city, the COLI for New York would be 120.

                It is also important to consider the average income for the chosen region. For example, a city in the south of the US may have a lower cost of living than most cities on the east or west coasts. However, the average income in that southern city may be lower than the cost of living there.

                https://blog.roboforex.com/wp-content/uploads/2022/12/Coli-calc-1402x828.png

                The difference between COLI and CPI

                The government and the Central Bank of a country are usually guided by changes in the official, regularly published Consumer Price Index (CPI) when estimating the rate of inflation. This is essentially the change in the value of a basket of basic goods and services chosen to measure price growth in the economy.

                The COLI is a cost-of-living measure that more fully accounts for changes in consumption expenditure associated with current economic conditions. It estimates the entire set of goods and services consumed by households, also taking into account those received free of charge from government or non-profit institutions.

                Read more at R Blog - RoboForex

                Sincerely,
                RoboForex team

                Comment


                • Dear traders!

                  This week, the ContestFX project will continue, as usual, with the following exciting competitions:

                  The 141st competition of "Demo Forex" is approaching the final stage.
                  The 393rd competition of "Week with CFD" has kicked off today.
                  The 527th competition of "Trade Day" will start on 28.12.2022 at 12:00.
                  The 441st competition of "KingSize MT5" will start on 29.12.2022 at 20:00.

                  Do not forget that for winning any of our demo account contests, you will receive funds to your real account that you can use to start trading in the Forex market instead of investing your own savings.

                  We wish you good luck!

                  Sincerely,
                  RoboForex Contest

                  Comment


                  • Intraday Trading – What is It?

                    Author : Anna Rostova


                    Day trading or intraday is short-term transaction on stock exchanges performed during the same trading session without roll-overs. This way of trading is quite peculiar, because this approach requires traders to consider all incoming information, such as news, statistics, external factors, and a lot of other events. Market responses can be very quick, but short-term at the same time. This is exactly what is interesting for intraday investors. When trading within the same trading session, they have an opportunity to save their time and get profit in much shorter periods.

                    Nowadays it’s safe to say that intraday trading is a major driving force on financial markets. The current statistics shows that In the USA, where intraday trading is allowed since 1996, about 70% of intraday investors were losing their profit on NASDAQ stock exchange during the period from 1996 to 2000. Why? Because traders, who wanted to increase their margin, increased their risks as well. This is a subtle aspect of intraday trading.

                    Capital and risk management

                    Below you will find a lot of theoretics about this, but the only thing that should be remembered for sure – no positions are rolled over. The position opened today must be closed today. In order to minimize risks, trades must have a good knowledge of daily volatility (it can be figured out in advance by monitoring the market to know what to expect). Of course, there are life hacks, for example, the time, when the Asian session is ending and the European is starting, is pretty good for opposite positions.

                    When managing risks, it’s very important to remember that daily limitations for profit and losses is a necessary and essential aspect for intraday traders.

                    https://blog.roboforex.com/wp-content/uploads/2019/07/shutterstock_458585623-945x630.jpg

                    Day trading strategies

                    As a matter of fact, there is only one strategy: close all open transactions before the current trading session is over. To scratch beneath the surface, intraday strategies may be of two types, scalping and news trading. Let’s discuss both of them in more details.

                    Scalping is very simple and efficient. To use this method of trading, you have to set a clear threshold to close an order. If your plan implies “5x5” approach, then in case the current trend changes by 5 points in any direction, your order must be closed (with profit or loss, it doesn’t matter). In one case a scalper will get profit of 5 points, in the other one – lose the same amount. To minimize risks when the current trend starts moving in the wrong direction, traders use technical analysis of an asset behavior and place Stop Loss orders quite close to the price. Taken together, these things may really prevent traders from running many risks. One doesn’t have to follow “5 points rule” – as time passes and experience comes, traders find their own best way to close orders. The key thing is to close them no matter what.

                    Another thing that should be mentioned here is that liquidity of an asset is very essential for intraday trading. One is recommended to work with the assets that are highly liquid or the assets with strong trends and higher volatility. These factors are required to expand trading opportunities to earn more during the day.

                    Advantages and disadvantages of intraday trading

                    Intraday trading is a very energy-consuming process, which may be very challenging and exhausting, especially at first. Psychoemotional state is very important. When they talk about being a “cool head” and “getting rid of all emotions”, they mean intraday trading. When an intraday order is open, there won’t be time to calm down. One should remember this from the very beginning.

                    In order to handle emotions, one should limit risks and decide on the part of deposit one is going to use on a particular day. By opening an order worth 5-6% of the entire portfolio, a trader skates on really thin ice. For starters, 1-2% of the deposit will be enough. As experience comes, this number can be safely increased.

                    Read more at R Blog - RoboForex

                    Sincerely,
                    RoboForex team

                    Comment


                    • What is Scalping on Forex?

                      Author : Dmitriy Gurkovskiy


                      Who in the world of trading hasn’t heard of scalping? Probably, you may know it as pipsing, but all traders surely heard a lot of different things about it, some of them tried it in practice, others are just going to, that’s why I guess it would be interesting to go into details of such thing as scalping.

                      Scalping definition

                      Let’s start with the definition. Scalping is a type of a trading strategy for trading on currency, stock and commodity markets. The distinctive feature of scalping is closing an order when the profit reaches several pips. This definition is offered by a lot of public trading-related web resources. In addition to that, some of they say that a scalping position is held from several second to several minutes. Under this approach to scalping, it may be regarded as an element of a high frequency trading.

                      We can go deep in the theme and “lift the curtain” over scalping, which is considered by many traders as almost perfect and advanced method of trading.

                      The question above helps expand the concept of scalping as it is, because the period of holding an order is too small, the profit may be almost equal to spread expenses, and the risk level for a position may by far exceed the potential benefit. In today’s technology intensive world, computers are vastly superior to enthusiasts of manual trading, but this competition allowed traders to expand the border of scalping as a trading instrument.

                      https://blog.roboforex.com/wp-content/uploads/2019/10/pips-trading.jpg

                      One should realize that there is a difference between scalping on the Forex and stock markets. In case of the former, traders use additional tools, such as Time & Sales and Depth of Market. Some Forex brokers make concessions and reduce commissions for scalpers. However, efficiency of scalping on stock markets even with additional helpers is rather questionable. The key thing in trading is the market liquidity, while scalping can be used even during periods of low volatility and liquidity.

                      Scalping strategies

                      Most scalping strategies are based on breakouts of support and resistance areas, for selling and buying respectively. Additional tools that are used by traders for determining support/resistance levels are line charts embedded in trading platforms (MT4, MT5, R WebTrader, etc), as well as fractal indicators, Parabolic SAR, and almost full range of Envelope-type indicators, which form mobile support/resistance levels taking into account volatility and averaged price movements per specified numbers of candlesticks.

                      The figure shows an example of scalping strategy using the VoltyChannel_Stop indicator. The logic of this system is based on a breakout of the indicator’s endpoint as a signal to open an order. The price movement range after the control level had been broken was from 4 to 34 pips, which is quite enough for a scalper. The only thing that may raise questions is where exactly every scalper intends to close their order.

                      In other words, possible profitability can be calculated in some specific range. We should also note that scalpers use quite large parts of their deposits in trading, from 10% to 50%. Depending on the opening/closing strategy, a scalper opens from 5 to 50 orders in case of constantly being in front of a computer and trading very actively. Consequently, we can calculate that scalper’s daily profitability may vary from 2% to 100%, but it requires a lot of work without any breaks.

                      Read more at R Blog - RoboForex

                      Sincerely,
                      RoboForex team

                      Comment


                      • Dear traders!

                        The RoboForex Company project called ContestFX congratulates you on the coming year 2023 and wishes health and prosperity to you and your loved ones! This new year, our demo contests will start on January 2, and you will be able to take part in them, as usual, completely free:

                        The 142nd competition of "Demo Forex" and the 394th competition of "Week with CFD" both will start on 02.01.2023.
                        The 528th competition of "Trade Day" will start on 04.01.2023 at 12:00.
                        The 442nd competition of "KingSize MT5" will start on 05.01.2023 at 20:00.

                        The winners of our contests will receive their prize money deposited to their real trading accounts.

                        We wish you good luck throughout the 2023 year!

                        Sincerely,
                        RoboForex Contest

                        Comment


                        • Harmonic Patterns in Trading

                          Author : Victor Gryazin


                          In this article, we will consider the use of harmonic patterns in trading. We will get acquainted with the history of their emergence, and the principles of their formation, and tell you about the most popular patterns.

                          What are harmonic patterns?

                          Harmonic patterns are graphical price patterns based on a combination of Fibonacci ratios and Elliott wave elements. The basis for such patterns was laid down in the works of Harold Gartley, a renowned analyst, and technical analysis specialist. His book "Profits in the Stock Market" describes his trading methodology in detail.

                          The harmonic patterns became widely known and popular at the end of the last century when Gartley's works were further developed by his followers – Scott Carney, Larry Pesavento, and Bryce Gilmore. They have refined the description of already known models, and also identified and described new ones.

                          Harmonic patterns are versatile: they can be used to trade on different timeframes and financial markets. The most popular are Gartley, Butterfly, 5-0, Crab, ABCD, Bat, and Shark.

                          Gartley pattern

                          The Gartley pattern is one of the first harmonic patterns described. It is also called "Gartley's butterfly" because of the similarity in the outlines of price movements, and the Fibonacci lines on the chart resembling the wings of a butterfly.

                          Stages in the formation of the Gartley pattern:
                          • XA is the first impulse of the price movement on the chart
                          • AB is the correction from the first XA movement at approximately 61.8%
                          • BC can be 38.2%, 50%, 61.8%, 78.6%, 88.6% of the AB wavelength
                          • CD can be 127.2%, 146%, 150%, and 161.8% of the BC wavelength and ends around the correction level of 78.6% of the XA wavelength
                          • The D-point is the final point in the pattern, where a reversal of quotes is expected

                          https://blog.roboforex.com/wp-content/uploads/2022/12/Harmonic-1-768x398.jpg

                          Butterfly pattern

                          The Butterfly pattern, created by Bruce Gilmore, is very similar to the one mentioned above. Therefore, understandably, many traders confuse the two.

                          Stages in the formation of the Butterfly pattern
                          • XA is the first impulse of the price movement on the chart
                          • AB is the correction from the first XA movement at approximately 78.6%
                          • BC can range from 38.2% to 88.6% of the AB wavelength
                          • CD can range from 161.8% to 224% of the BC wavelength and ends at about 127.2% of the XA wavelength
                          • The D-point is the final point in the pattern, where a reversal of quotes is expected

                          https://blog.roboforex.com/wp-content/uploads/2022/12/Harmonic-2.png
                          5-0 Pattern

                          The 5-0 pattern was first described in detail in Scott Carney's book "Harmonic Trading: Volume Two", which was published in 2007. Visually, it resembles the Head & Shoulders and Wolf Waves patterns.

                          Read more at R Blog - RoboForex

                          Sincerely,
                          RoboForex team

                          Comment


                          • 11 Rules of Effective Capital Management On Forex

                            Author : Timofey Zuev

                            There is no successful Forex player that has achieved a good and stable result without an efficient money management system. Wise and weighted up capital management allows for playing on the high-risk market thanks to marginal trading. In this article we are going to have a look a the main rules and principles of money management on Forex.

                            Rule № 1

                            The size of the margin must not exceed 10-15% of the deposit.

                            https://blog.roboforex.com/wp-content/uploads/2019/10/shutterstock_608737850.jpg

                            This rule helps calculate the margin for the orders to open. The remaining sum is necessary for normal work of the trader and for avoiding force majeure on the market: Forex may behave unexpectedly.

                            As for the suggested margin, its maximum size is not always the same. For example, Murphy suggested that it should not exceed 50%; however, other sources advise to stick to the margin amounting to 5 to 30% of the deposit. Anyway, the approach should go in line with the initial size of the deposit, as long as the smaller it is, the harder it is to go along the conservative way.

                            Rule № 2

                            The investment into one instrument or a group of assets with high correlation coefficient must not exceed 15% of the deposit.

                            This helps diversify risks and avoid strong dependence on the result of the trade.

                            On Forex there are groups of instruments as yen pairs, groups of allied currencies like EUR/USD и GBP/USD, AUD/USD и NZD/USD, metals like XAU and XAG and so on. Currency pairs of one group normally move in the same direction, slightly lagging behind one another. Thus, large investments into one instrument or the assets of one group go against the rules of risk control. The principles of efficient funds use are also to be kept in mind. Money should be allocated in such a way that a trade resulting in a large loss does not rid the trader of the whole deposit.

                            Rule № 3

                            Each instrument must imply a risk no bigger than 5% of the deposit.

                            https://blog.roboforex.com/wp-content/uploads/2019/10/shutterstock_1411852109.jpg

                            This rule seems rather arguable, and its feasibility to a big part depends on the size of the trading capital. The risk of the trade may vary from several tenths of a percent to 10-20%. It does not relate to traders who do not regulate risks at all, the only limit being the size of their deposit.

                            If we turn to classics, Elder suggested 1.2-2.0% risk for one trade, Murphy – 5.0%.

                            Rule № 4

                            Define the level of diversification of instruments.

                            Regardless of diversification being one of the most efficient ways of protecting money, one should not overuse it. There should be a certain balance between concentration and diversification of assets. Excess diversity of the instruments used in trading makes the trader lose their concentration which may lead to untimely reaction to the market movements and a decrease of productivity.

                            Allocation of assets to 5-6 different instruments of various groups is considered most efficient. The bigger the coefficient of inverse correlation is, the higher is the diversification level.

                            Rule № 5

                            Put Stop Loss orders.

                            The main purpose of Stop Loss order is to limit the trader’s losses. Some put them every time opening a trade, others do so only for the time of their absence from their workplace. However, it is always worth remembering that Forex is an unpredictable market, and the movements of currency pairs can be sharp and quick. As a consequence, traders may suffer excessive losses, because they may not react in time, even sitting in front of the computer screen.

                            The size of a Stop Loss depends on two factors: the size of the loss that the trader is ready to suffer and the situation on the market.

                            Let me give you an example. The trader’s deposit is 1,000 USD. The risk of a trade is 5%. The volume of the trade is 0.02 lot. In such circumstances they can afford a loss of 50 USD, and in case the price is 0.1 USD per 0.01 lot for a pair, as, say, with GBPUSD, the Stop Loss should be no farther than 250 points from the entrance to the position.

                            Read more at R Blog - RoboForex

                            Sincerely,
                            RoboForex team

                            Comment


                            • Dear traders!

                              This week, the ContestFX project is waiting for everyone in the following competitions:

                              The 142nd competition of "Demo Forex" is gaining momentum.
                              The 395th competition of "Week with CFD" has just kicked off.
                              The 529th competition of "Trade Day" will start on 11.01.2023 at 12:00.
                              The 443rd competition of "KingSize MT5" will start on 12.01.2023 at 20:00.

                              Joining the list of our contestants is easy - all you need to do is to go through a simple registration procedure, and all of the competitions you may want to take part in will become available in just a couple of mouse clicks.

                              We wish you success!

                              Sincerely,
                              RoboForex Contest
                              ​​

                              Comment


                              • Gann Concept in Trading: Fundamentals, Algorithm

                                Author : Timofey Zuev


                                In this article we shall discuss the trading method of William Delbert Gann. While alive, Gann managed to become a legend thanks to his exact market forecasts. First, a bit of his biography. He was born in the family of a poor farmer that cultivated cotton. In early childhood William got to know that the family’s income depended on the prices on “some market”. So, he was eager to know, how and why the prices for cotton change. Later this desire led him to the New York stock exchange, where he opened his broker company 5 years later. However, real success found him when he forecast the capitulation of Germany in the World War I.

                                Gann became known for his “sniper” forecasts based on his unique trading method, which later transformed into a whole concept.

                                As a great sportsman of present time said, the main thing that is left after a person is their legacy. Well, Gann left a great intellectual baggage after himself. Perhaps, not every trader knows his name, but each and every has at least come across the phrase “Gann’s theory”, not to speak about William Gann’s many followers.

                                Gann’s theory: main theses

                                The main thesis of Gann’s theory is based on the postulate about the necessity of the balance between the price (quotation) and time.

                                Financial markets are very dynamic in essence, which, naturally, makes them attractive for speculators. The level of volatility (variability) of markets can be different. Rate fluctuations on Forex can differ in frequency and amplitude. Meanwhile, Gann’s theory states that in any price change one may see certain patterns. In other words, though chaotic at he first sight, fluctuations of quotations presuppose a certain degree of order in their structure. The ability of a speculator to identify this data timely guarantees that their forecasts will have a real basement and come true in the end. As the author of the theory said: “Future is a repetition of the past”. Which means that all actions on the market are cyclic and can be forecast.

                                An argumentative forecast of the market dynamics is an indisputably important factor of success of any speculative trade.

                                Gann’s theory states that a very important moment of the market analysis is to define the so-called balance points correctly. These points of balance between the price and time let the player forecast future rates and detect the priority vector of further market dynamics.

                                Gann developed a lot of instruments meant to help the analyst (trader) define the aforementioned points:
                                • using patterns, formed by market fluctuation patterns;
                                • using “angles” and “squares” of time and price (quotations);
                                • studying the factors of time.
                                Apart from this, on the basis of William Gann’s drafts, several indicators have been developed; they lay the foundation of the market analysis according to Gann’s method. By the way, Gann Grid is integrated into each MT4 and MT5 terminal, which proves the genius of Gann and his theory (Insert-Gann):

                                https://blog.roboforex.com/wp-content/uploads/2020/01/gann-977x630.png

                                According to the basic theses of Gann’s theory, financial market can be interesting for speculations in two typical cases only:
                                • when time goes ahead of the price on the chart;
                                • when the price goes ahead of time on the chart.
                                If the market remains in perfect balance for a long time, it is of no particular interest for trading as no significant movements are to be expected.

                                The essence of Gann’s theory

                                On the whole, Gann’s theory is based on drafting certain geometrical patterns and angles. When analyzing the market according to Gann, the main attention is paid to the interrelation of time, price and the patterns. Thus, for successful market forecasts one should know how to use squares, circles, angles, lines etc. What is more, each figure is to be used at the right moment and in the right order.

                                All the aforementioned reveal the main drawback of the theory – it does not suit inexperienced traders. Some traders use the main principles of the theory and certain indicators separately, which is wrong in the essence. For successful use of Gann’s theory all its components should be applied in complex, because they supplement each other, and the trader should perform the whole series of actions when analyzing market movements.

                                Read more at R Blog - RoboForex

                                Sincerely,
                                RoboForex team

                                Comment

                                Working...
                                X